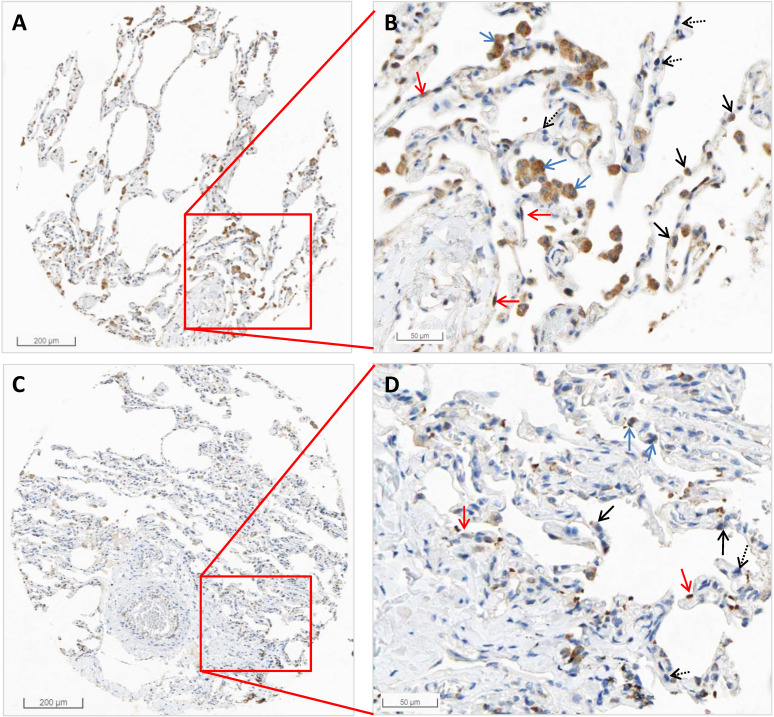
Figure 2.
The representative images by IHC in normal tissues of the lungs of HSPA5. The protein expressions for HSPA5 from normal tissues were obtained in the database of the Human Protein Atlas (HPA) (https://www.proteinatlas.org/ENSG00000044574-HSPA5). A. IHC images from the tissue of normal lungs from a female of age 49 (Patient id: 2268). B. Enlarged picture from A. C. IHC images from the tissue of normal lungs from a male of age 21 (Patient id: 2101). D. Enlarged picture from C. Arrows in blue indicate the representative positive results for macrophages, arrows in red indicate the representative positive results for type I alveolar epithelial cells, arrows in black indicate the representative positive results for type Ⅱ alveolar epithelial cells (Fig.2C, black arrow), and arrows in dashed black indicate the representative negative staining for type Ⅱ alveolar epithelial cells. The scale bars for 200 µm and 50 µm are indicated.

