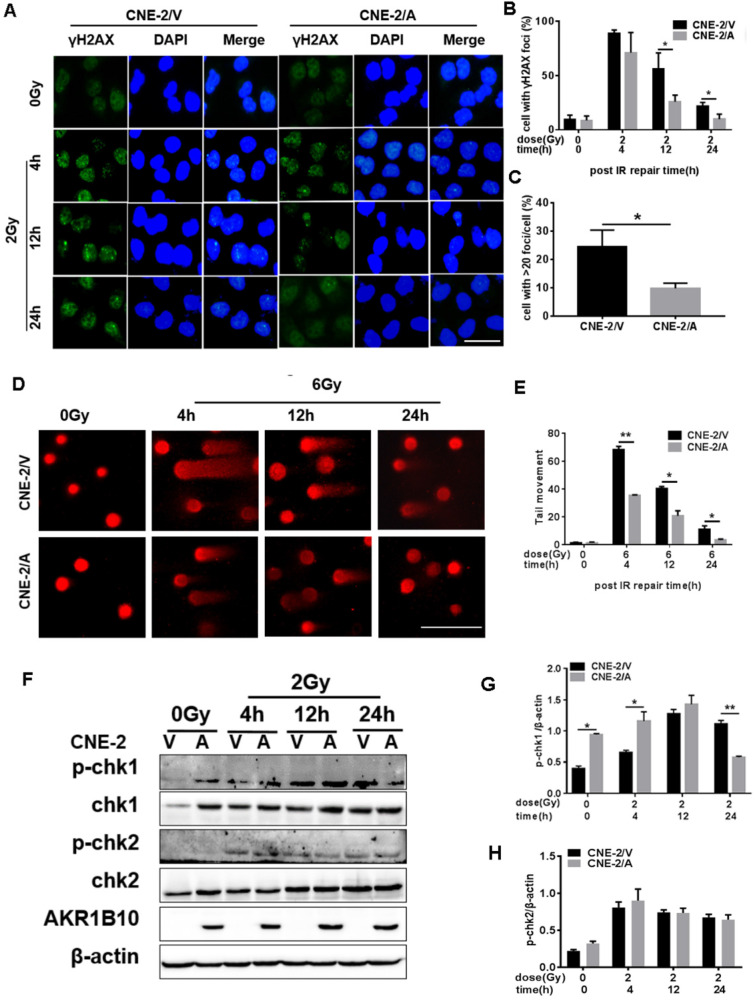
Figure 3.
Evaluation of DNA damage after irradiation in AKR1B10-overexpression NPC cells. (A) The γH2AX staining of CNE-2/AKR1B10 cells (the scale bar represents 50 µm). (B and C) Statistics of the percentage of γH2AX foci and foci greater than 20 in CNE-2/AKR1B10 and CNE-2/vector cells. (D and E) The comet assay of CNE-2/AKR1B10 cells after IR treatment. D is one of the representative Images and E is the statistics result of three expreiments (counting 100 cells per group, Scale bar 200μm). (F) The effect of AKRB10 expression on cell cycle checkpoint proteins expression by Western blot after IR treatment. (G and H) The relative quantification analysis of the change of phosphorylated CHK1 and CHK2 between the control group and the experimental groups. The signals of protein bands relative to β-actin in three experiments were quantified by ImageJ software. IR: irradiation; Gy: GrayA; A: AKR1B10; V: vector, psin-EF2-puromycine; CNE-2/A: CNE-2/AKR1B10, AKR1B10-expressed CNE-2 cells; CNE-2/V: CNE-2/AKR1B10 vector, CNE-2 control cells; p-CHK1: phosphorylated CHK1; p-CHK2: phosphorylated CHK2. *P < 0.05; **P < 0.01.

