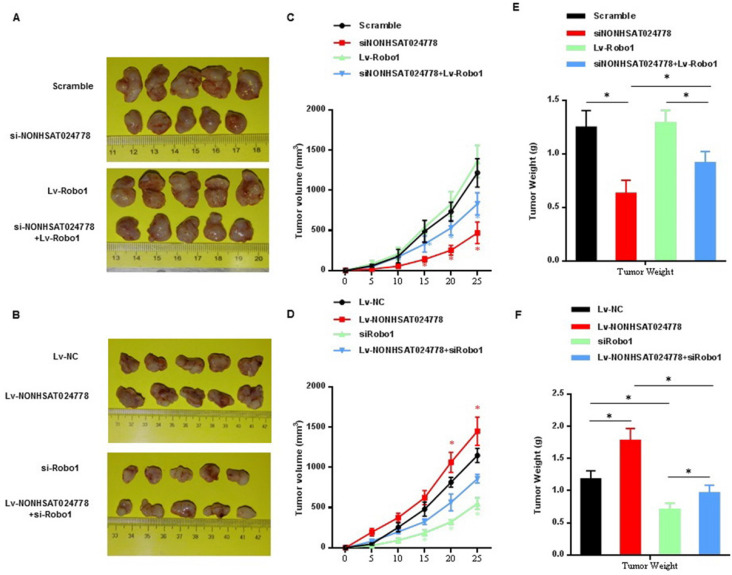
Figure 7.
The effects of NONHSAT024778 and Robo1 on tumor growth in a xenograft mouse model (*P<0.05). (A, B) The total visible tumors formed in si-NONHSAT024778, Lv-Robo1, si-NONHSAT024778+Lv-Robo1, Lv-NONHSAT024778, si-Robo1, Lv-NONHSAT024778+si-Robo1, or NC groups of nude mice, respectively. (C, D) Growth curves of tumor volume were calculated every 5 days. (E, F) Tumor weights from each group are represented.

