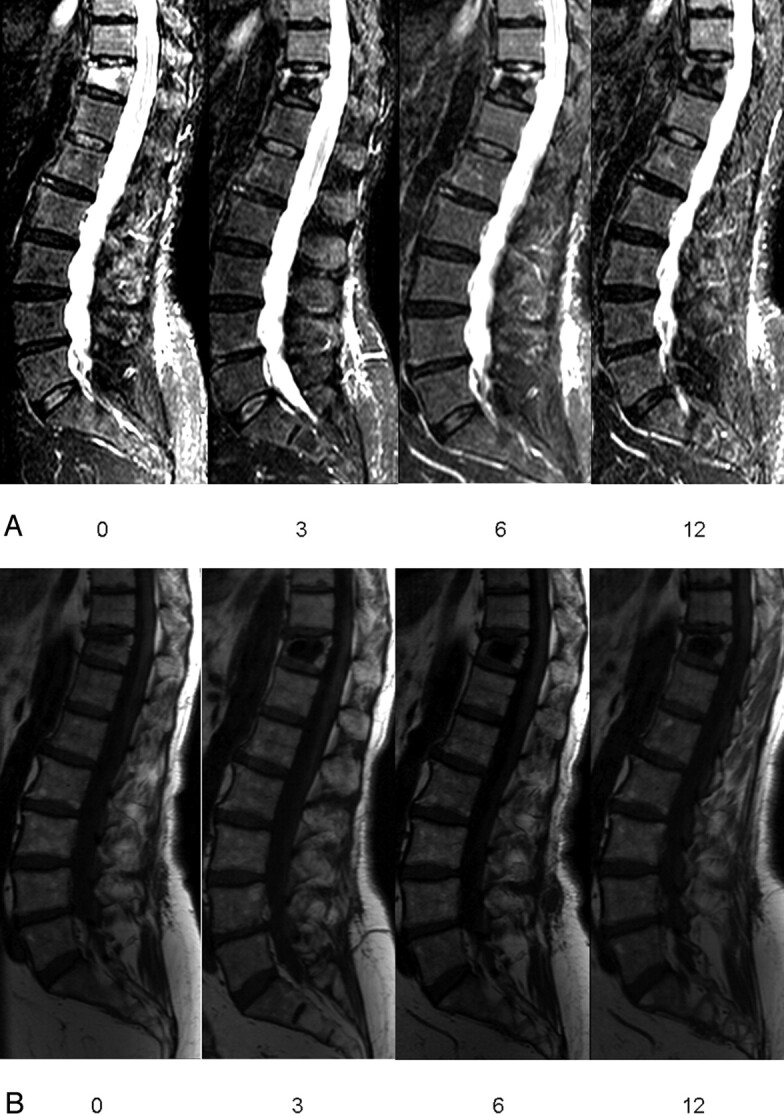
Fig 2.

Sagittal short τ inversion recovery (STIR) (A) and T1-weighted image (B) follow-up in a patient with osteoporotic vertebral compression fracture (VCF) T12 treated by percutaneous vertebroplasty (PV). Visual analog score for pain before (0) and at 3, 6, and 12 months after PV: 10, 2, 1, and 1, respectively. Patient used morphine pre-procedure (0) and no pain medication at 3, 6, and 12 months after PV. Percentage bone marrow edema (based on all images) in VCF T12 before (0) and at 3, 6, and 12 months after PV: 75%, 25%, 20%, and 0%, respectively.
