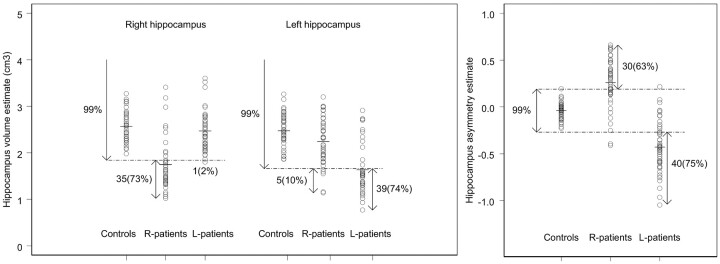
Fig 5.
Left and right hippocampal volume estimate (left panel) and hippocampal volume asymmetry index (right panel) for controls and patients with TLE. The dashed lines represent the 99% prediction lower bounds for the left and right hippocampal volume estimate (left panel) and the 99% prediction interval for the hippocampal volume asymmetry index (right panel). The proportion of patients showing abnormal hippocampal volume is indicated in parentheses.

