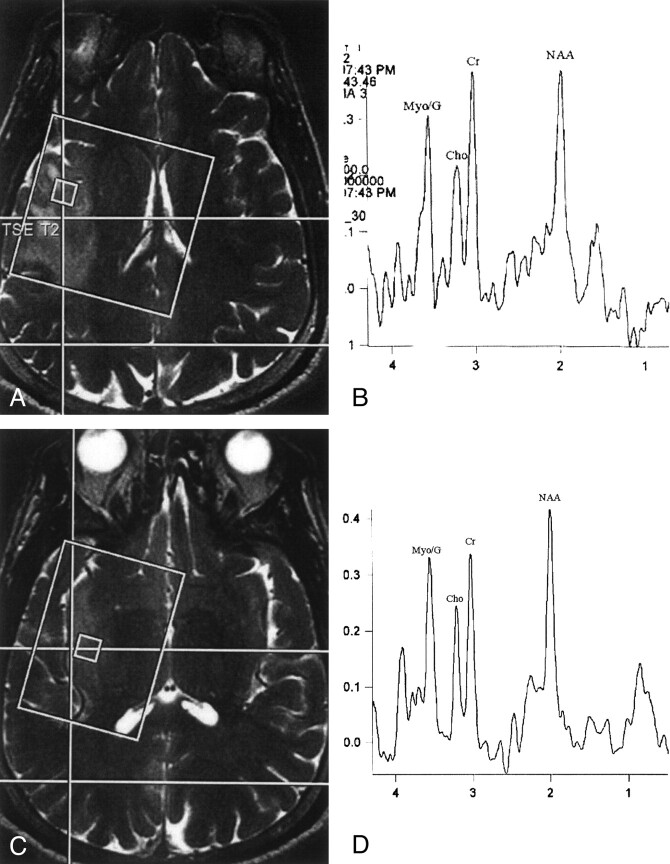
Fig 2.
A, Localizer T2-weighted MR image shows position of voxel within the area of high signal intensity in the right insula.
B, Proton MR spectroscopic image (TE 30) obtained from the image shown in A shows low NAA, elevated Cr and m-Ins/Gly (MyoG), and normal appearing Cho.
C, Localizer T2-weighted MR image, obtained 15 mm below the level at which the image shown in A was obtained, shows position of the voxel within area of increased signal intensity in the right insula.
D, Proton MR spectroscopic image (TE 30) obtained from the image shown in C shows mildly decreased NAA, normal Cho to Cr relationship, and elevated m-Ins/Gly. The spectra shown are similar and are representative of the pattern seen throughout the lesion.

