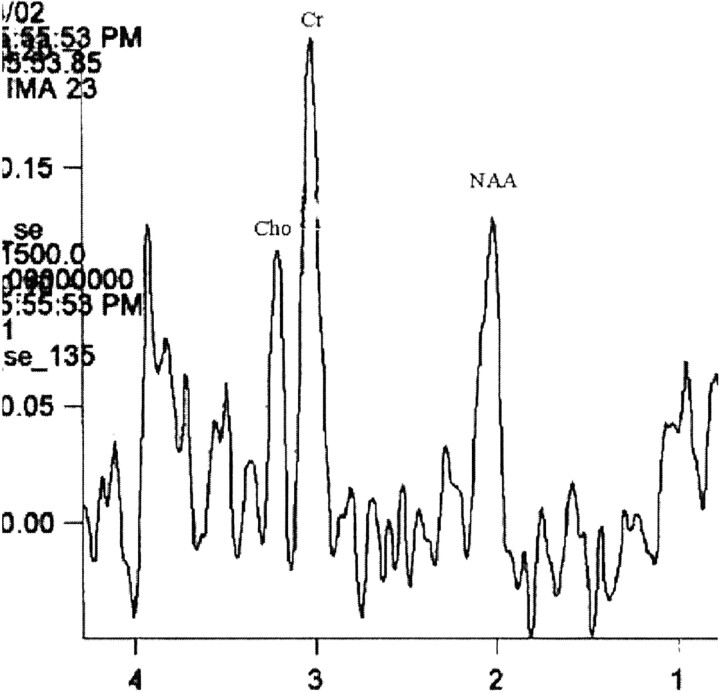
Fig 3.
Proton MR spectroscopic image (TE 135) obtained from a voxel within the area of T2 signal intensity abnormality. This long TE study confirms that the low levels of Cho and NAA revealed by short TE MR spectroscopy are not due to relaxation effects because they continue to be low. The Cr peak is high.

