
Fig 2.
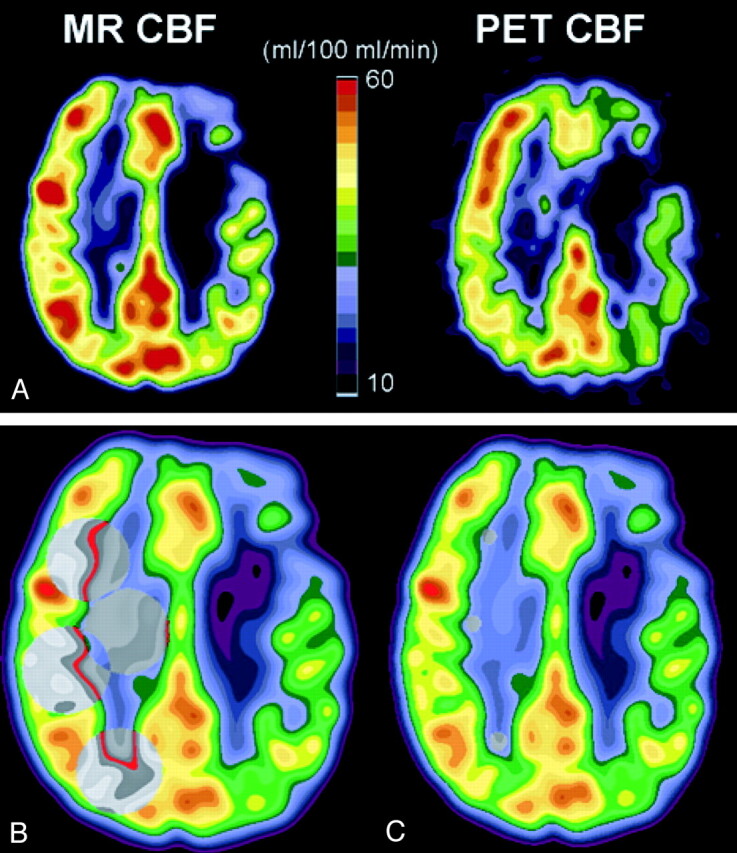
CBF in patient 4 (Table 1), who had occlusion of the left internal carotid artery.
A, CBF measured with dynamic susceptibility contrast-enhanced MR imaging (MR CBF, left) and CBF measured with [15O]-H2O PET (PET CBR, right). Axial view MR image and PET scan are co-registered to the same location, filtered to the same spatial resolution as the PET scan, and displayed with the same color scale. Diffusely decreased CBF in the left hemisphere, ipsilateral to the occluded carotid artery, can be identified on both the MR image and PET scan, with more severely reduced CBF focally within a chronic infarct in the left frontal lobe.
B, Large regions of interest (gray circles) for CBF measurement are shown on MR image obtained in the hemisphere contralateral to the carotid occlusion. Homologous regions of interest were placed in the hemisphere ipsilateral to the occlusion (see Methods).
C, Small subcortical regions of interest (gray circles) in normal appearing white matter of the hemisphere contralateral to the carotid occlusion are shown on MR image. These subcortical white matter regions were used to determine normal white matter CBF for the purpose of scaling relative CBF values measured by MR imaging to physically meaningful units of mL/100 mL/min (see Methods).