
Fig 5.
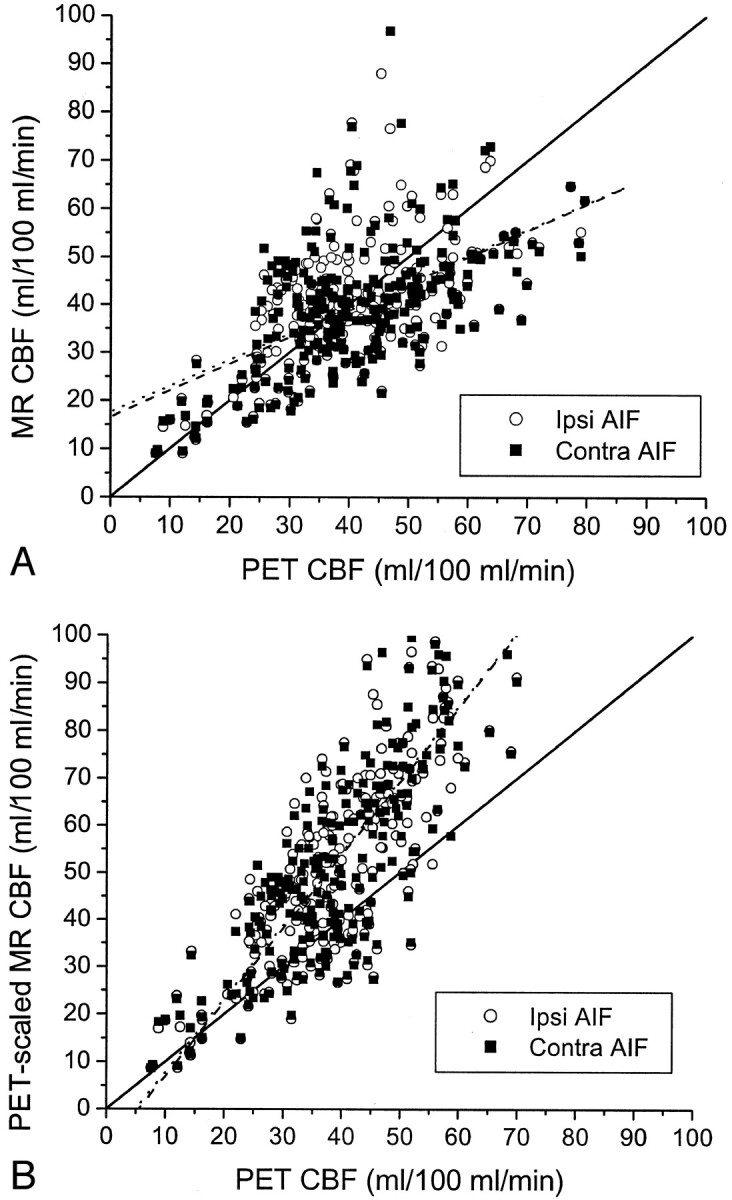
CBF in all seven patients.
A, Pooled data from all seven patients shows a statistically significant correlation between CBF values measured by MR imaging (MR CBF) and CBF values measured by PET (PET CBF), when CBF values measured by MR imaging are calculated with an AIF ipsilateral to the carotid occlusion (Ipsi AIF, open circles) (r = 0.60, P < .0001) and with an AIF contralateral to the occlusion (Contra AIF, closed squares) (r = 0.54, P < .0001). No significant differences were observed between the correlation coefficients, slopes, or y intercepts of the regression lines for the ipsilateral AIF (dashed line) and the contralateral AIF (dotted line). Both regression lines have slopes significantly <1 (P < .001) and y intercepts significantly >0 (P < .001). Relative MR CBF values were scaled to absolute units by assuming a normal white matter flow rate of 22 mL/100 mL/min (see Methods).
B, Use of white matter flow rates measured with PET for each patient to scale relative CBF values measured with MR imaging for each patient to absolute units improves the correlation between CBF values measured by MR imaging and those measured by PET, both for the ipsilateral AIF (open circles) (r = 0.85, P < .0001) and the contralateral AIF (closed squares) (r = 0.84, P < .0001). Again, no significant difference was observed between the correlation coefficients, slopes, or y intercepts of the regression lines for the ipsilateral AIF (dashed line) and the contralateral AIF (dotted line). However, both regression lines for PET-scaled CBF values measured by MR imaging versus CBF values measured by PET have slopes significantly >1 (P < .001) and y intercepts significantly <0 (P < .05).