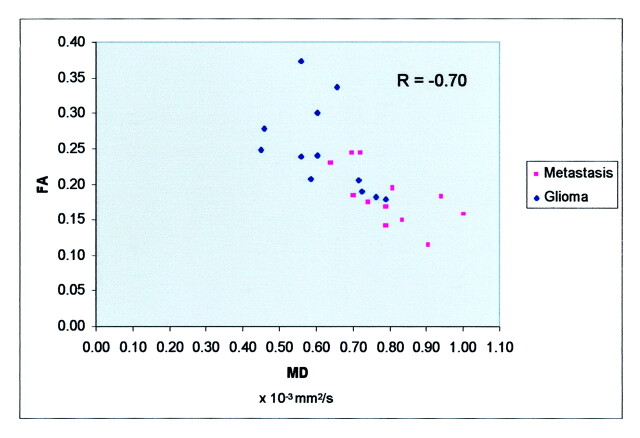
Fig 2.
Scatterplot of FA versus MD demonstrates lack of high correlation between the two variables (R = −0.70). The data in the metastasis group tend to lie within the higher range of MD, when compared with the data in the glioma group (P < .005). Along the FA axis, no such statistically significant discrepancy was observed.

