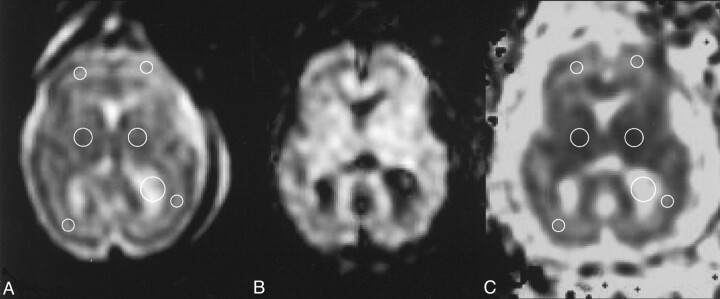
Fig 1.
Representative case (fetus 10 in Table). A, T2-weighted echo-planar image (b = 0 s/mm2), B, corresponding DW image, and C, resultant trace ADC map illustrate typical ROIs (circles in A and C) traced on an axial section at the basal ganglia level.

