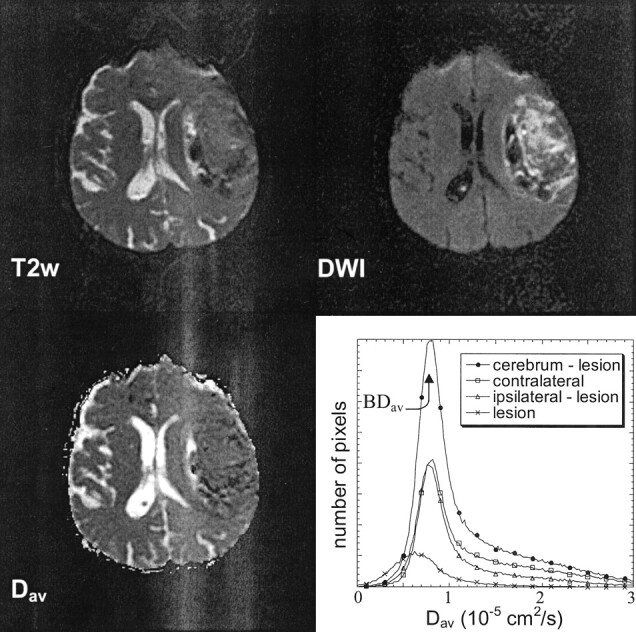
Fig 1.

Representative example of a typical ICH. T2-weighted image (T2w), diffusion-weighted image (DWI), and diffusion constant image (Dav) are shown. The quantitative analysis that was conducted focused on whole brain diffusion (inclusive of lesion) and brain diffusion ipsilateral and contralateral to the ICH measured by region-of-interest analysis on every section (exclusive of lesion). Lesion analysis included hemorrhage and all T2-weighted surrounding abnormalities that were cored out on every section in which they were visible. Histogram shows the distribution of diffusion constants in each region of interest. Location of the mean diffusion constant (BDav) is shown.
