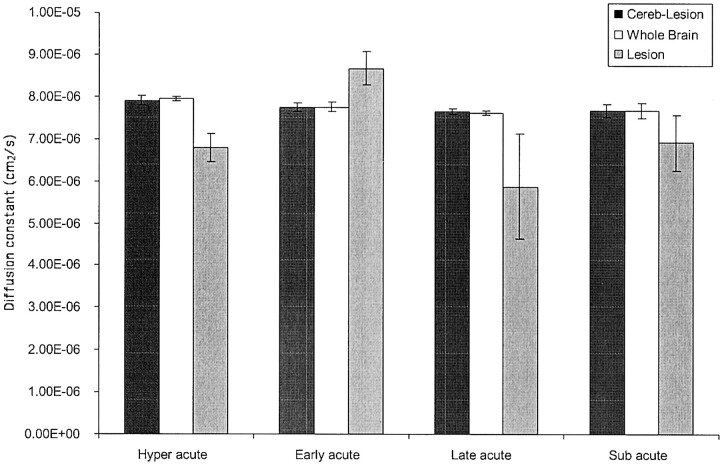
Fig 3.
Temporal changes during quantitative diffusion. Comparative bar histogram shows the evolution of diffusion changes over time in this series. Whole brain diffusion of the entire group as a whole remains elevated; this effect persists even when the lesion and all surrounding edema are “cored” out. Lesion analysis shows an evolution of diffusion changes. ICH is timed from a combination of history from ictus and neuroradiologic dating. Hyperacute (<24 hr) lesions show a lower diffusion constant because the hematoma is composed of primarily solid cells with unlysed RBCs that rise to a peak during the early acute phase (1–<5 days), with maximum focal edema response. The later phase (5–<10 days) shows its greatest decrease as probably inflammatory mediated cytotoxicity maximizes. The subacute phase (10–21 days) again shows the rise of diffusivity within the lesion as cells lyse and diffusion is no longer restricted.

