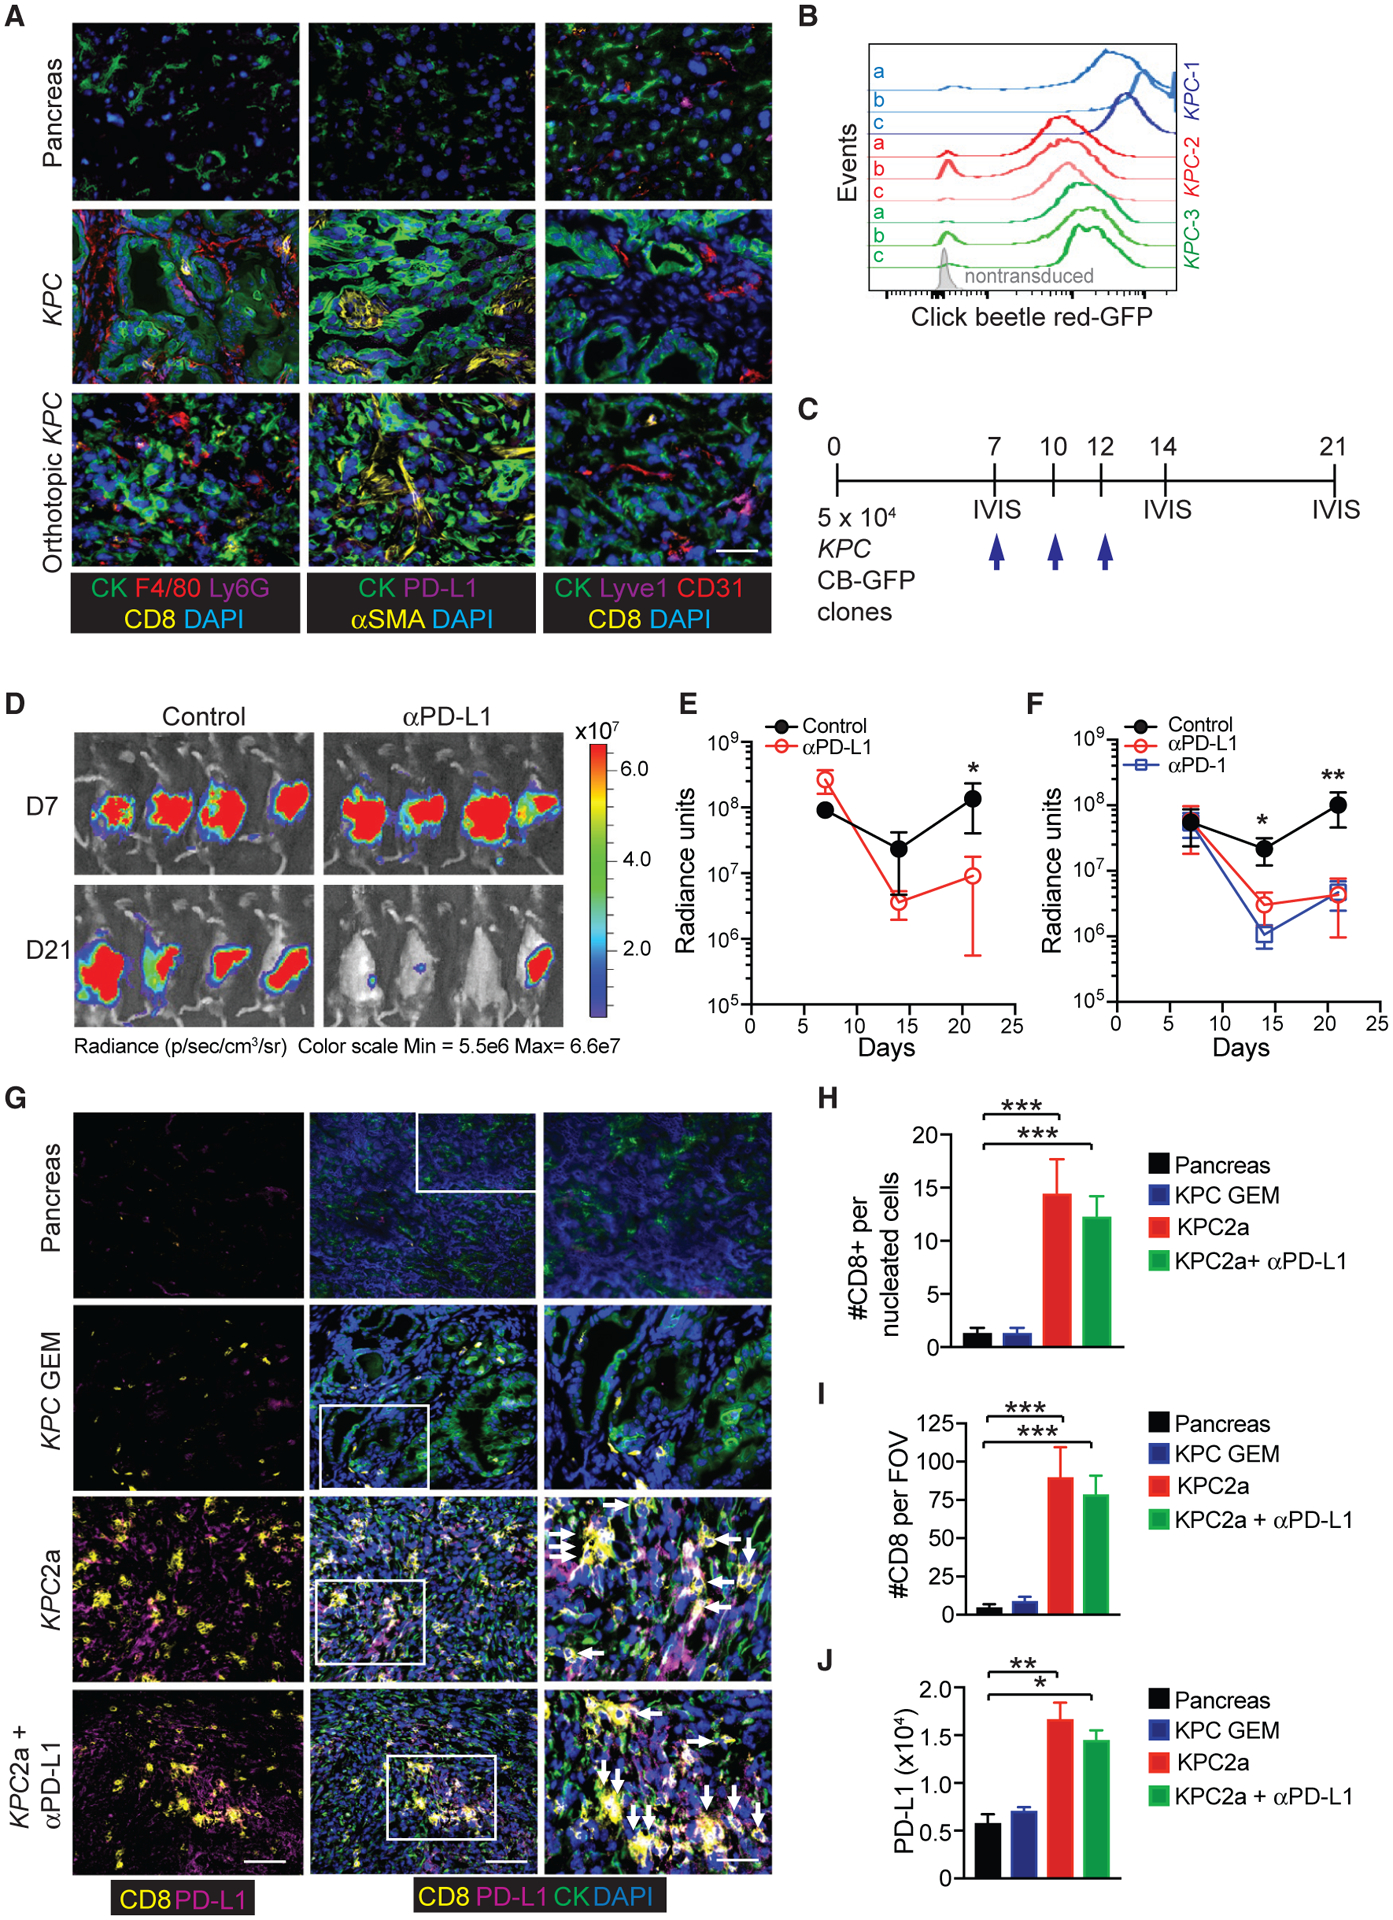
Figure 1. Generation of an Immunotherapy-Responsive Pancreas Cancer Animal Model.

(A) Representative immunofluorescent (IF) staining of wild-type mouse pancreas (top row), primary tumors isolated from a genetically engineered KPC mouse (middle row), and a polyclonal KPC TECs following orthotopic implantation into B6 pancreas at 3 weeks post-implantation (bottom row). Images depict cytokeratin+ (CK) tumor cells, CD8+ T cells, F4/80+ macrophages, Ly6G+ neutrophils, PD-L1, αSMA cancer-associated fibroblast (CAFs), CD31+ endothelial cells, and Lyve-1+ lymphatic venules. Scale bar, 25 μM.
(B) Histogram overlay of CB-eGFP+ KPC clones generated from three independent KPC mice. Shown are representative clones (n = 3) from the three independent polyclonal KPC tumor epithelial cell lines (KPC1–3).
(C) Timeline for orthotopic tumor cell injection, αPD-L1 treatments (blue arrows), and IVIS imaging.
(D) Representative IVIS imaging of tumor bioluminescence at 7 days (prior to treatment) and 14 days following the initial αPD-L1 injection (day 21 post-tumor).
(E) Radiance of tumor bioluminescence following orthotopic injection of a CB+KPC clone (KPC3b) and following αPD-L1 treatment. Data are mean ± SEM. *p < 0.05 (unpaired two-tailed Student’s t test). n = 5 mice per group.
(F) Radiance of tumor bioluminescence following orthotopic injection of a CB+KPC clone (KPC2a) and following treatment with either αPD-1 or αPD-L1. Data are mean ± SEM. *p < 0.05 and **p < 0.005 (unpaired two-tailed Student’s t test). n = 5 mice per group.
(G) Representative IF of CD8+ T cells, cytokeratin (CK+) tumor cells, and PD-L1 in wild-type mouse pancreas, primary tumor isolated from a genetically engineered KPC mouse, and KPC2a (CB+) orthotopic tumors isolated from B6 mice ± αPD-L1. Scale bars, 50 μM (left and middle columns) and 10 μM (right column, inset).
(H) CD8+ T cell number per all nucleated cells in IF sections. Data are mean ± SEM. n = 3–5 mice per group.
(I) CD8+ T cell number per field of view in IF sections. Data are mean ± SEM. n = 3–5 mice per group.
(J) PD-L1 intensity was quantified through pixel intensity measurement by Fiji 2.0.
Data in (H)–(J) are mean ± SEM. *p < 0.05, **p < 0.005, and ***p < 0.005 (one-way ANOVA, with a post hoc test to correct for multiple comparisons). Data are representative of n = 3–6 mice per group. See also Figure S1.
