
Figure 2. CB Expression Is Required for Immune Checkpoint Blockade Response.
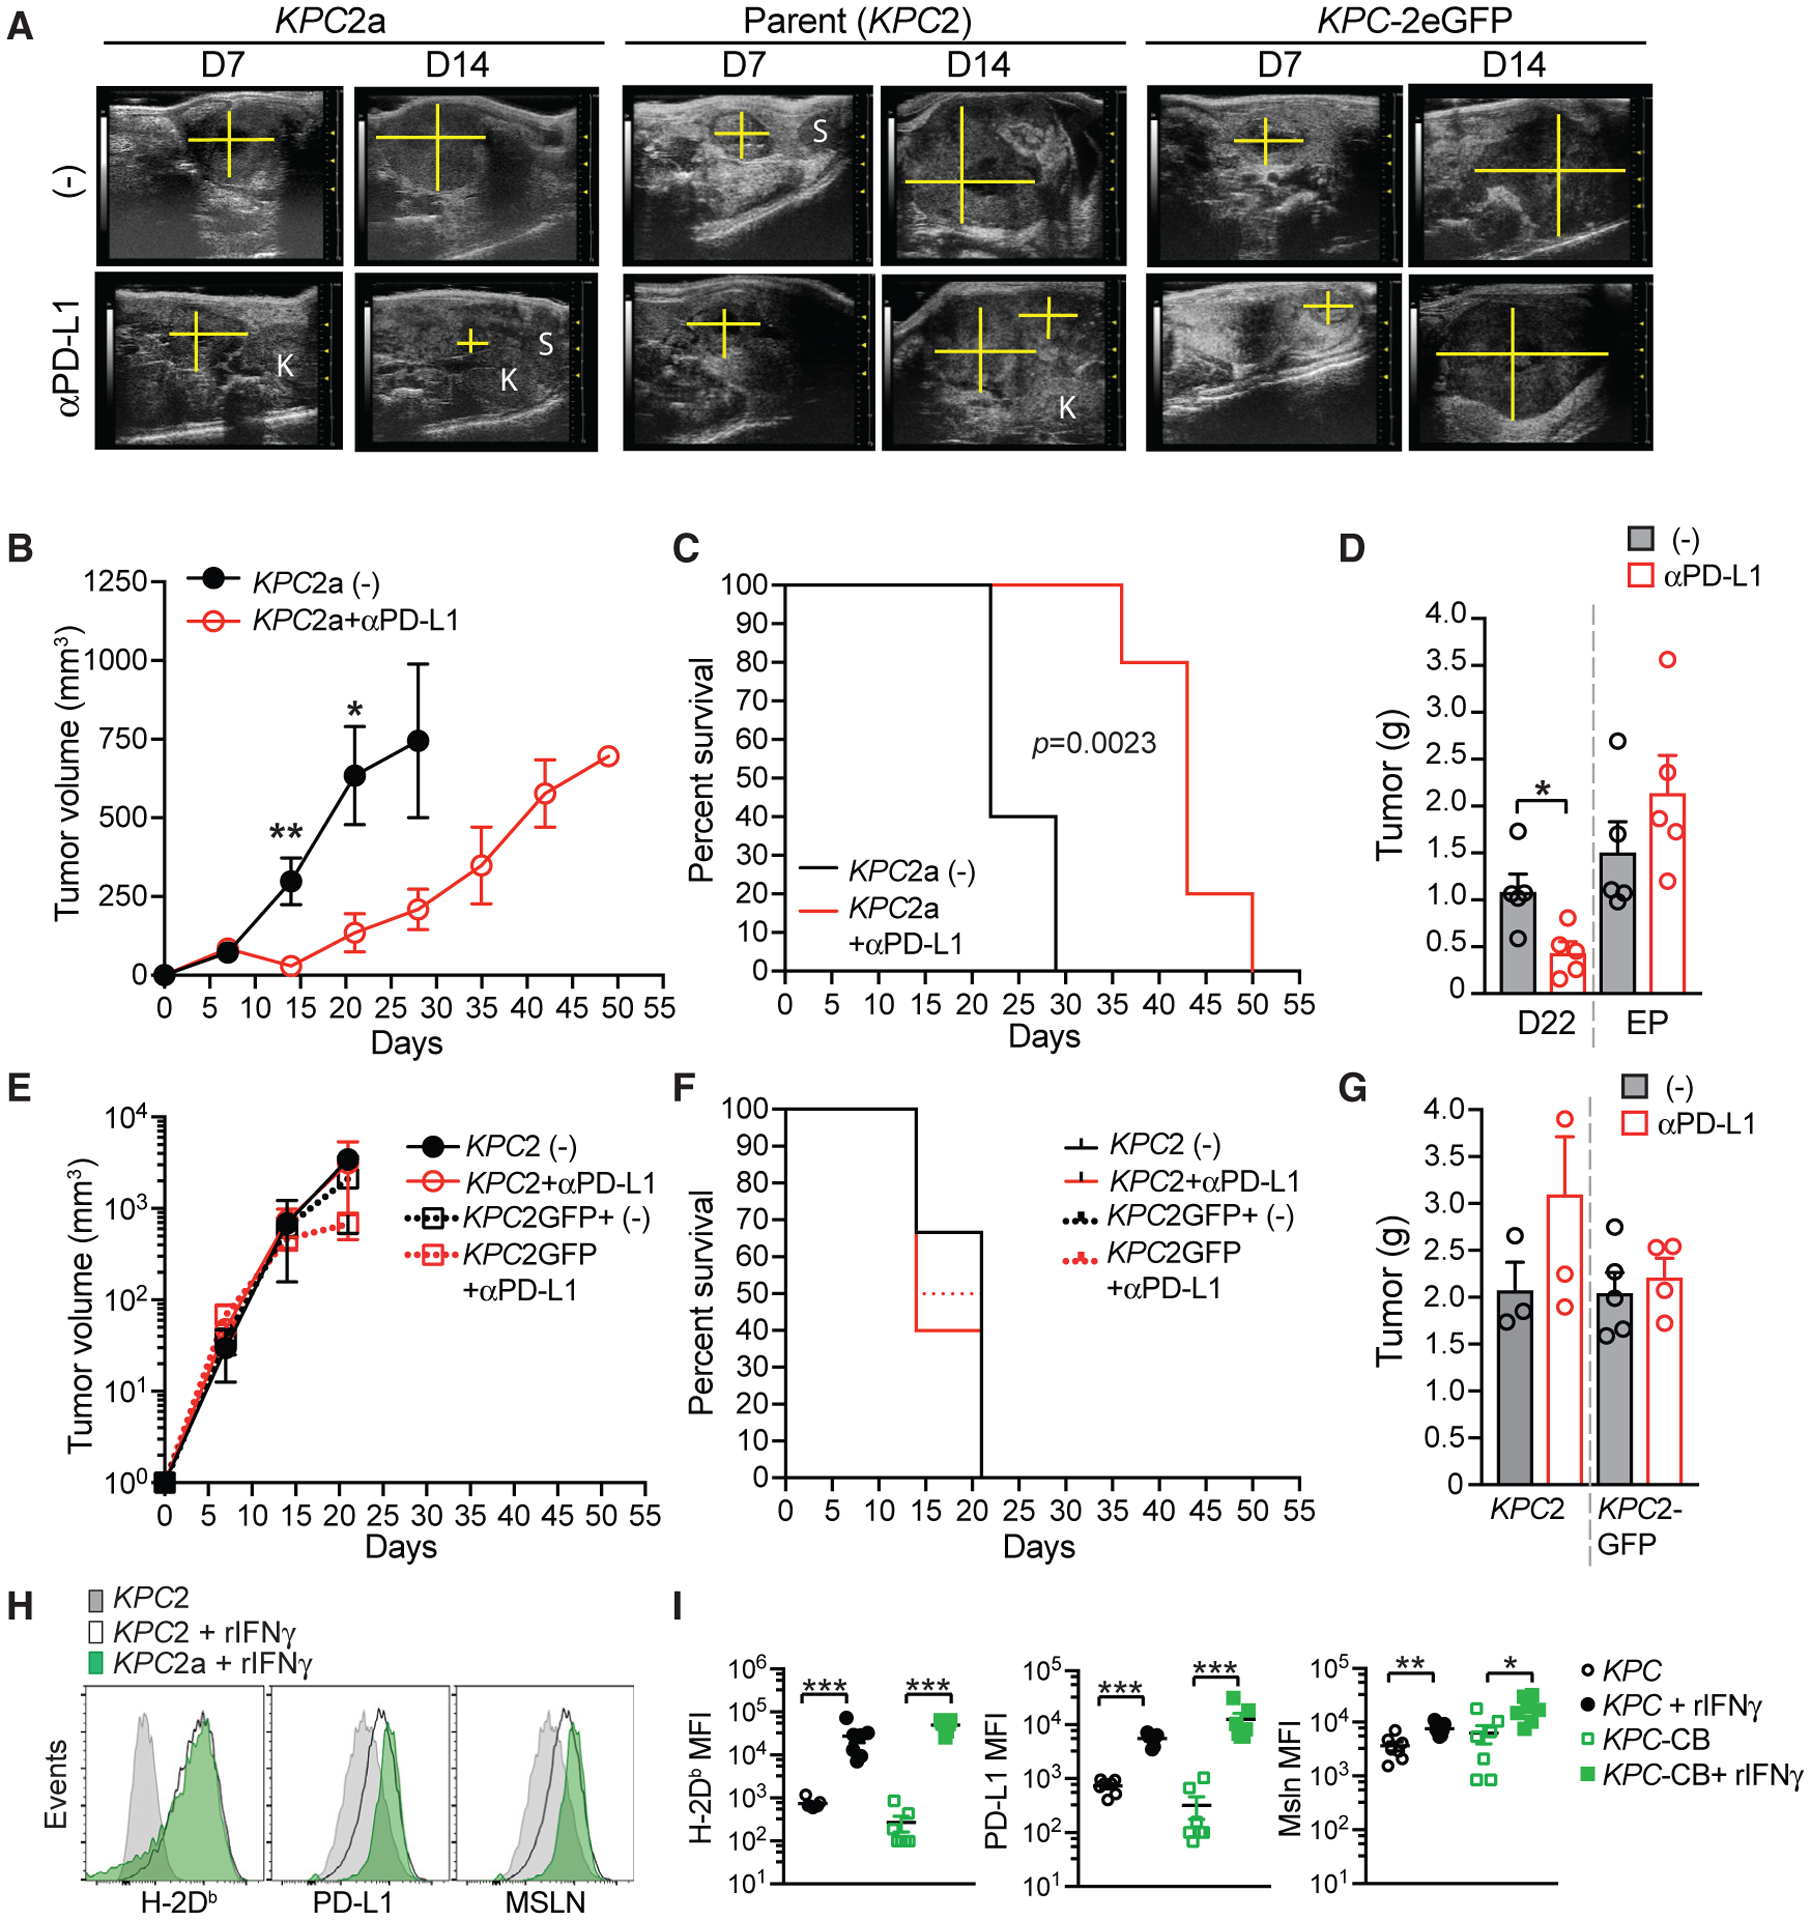
(A) Representative ultrasound images of pancreatic tumors in B6 mice orthotopically implanted with KPC2a (CB-eGFP+), KPC2 parental, or KPC2-eGFP tumor cells. Pancreas mass, yellow cross section; K, kidney; S, spleen.
(B) Mean tumor volume ± SEM. n = 5 mice per cohort. *p < 0.05 and **p < 0.005 (unpaired two-tailed Student’s t test).
(C) Kaplan-Meier survival curve of mice bearing orthotopic tumors. Significance was determined using a log rank (Mantel-Cox) test. n = 5 per group.
(D) Mean tumor weight in grams ± SEM at day 22 or at endpoint (EP; tumors > 500 mm3). Each dot is an independent mouse. n = 5 mice per group. *p < 0.05 (unpaired two-tailed Student’s t test).
(E) Mean tumor volume ± SEM of KPC2 parental or KPC-eGFP+ cells. n = 3–6 mice per group.
(F) Kaplan-Meier survival curve of mice bearing KPC2 parental or KPC-eGFP+ orthotopic tumors ± αPD-L1. n = 3–6 mice per group.
(G) Mean tumor weight in grams ± SEM at day 22 or at endpoint (EP; tumors > 500 mm3). Each dot is an independent mouse. n = 3–6 mice per group.
(H) Representative histograms of the indicated cell surface proteins in KPC2 parental and KPC2a clones ± 48 h pre-treatment with recombinant mouse IFNγ.
(I) Mean fluorescence intensity (MFI) of H-2Db, PD-L1, and mesothelin (Msln) expression by independent KPC parental tumor cells (n = 3) and their respective CB+ clones (KPC-CB) ± IFNγ. Each dot is an independent clone. Statistical significance was determined using Student’s t test to compare the induction of protein expression following IFNγ. *p < 0.05, **p < 0.005, and ***p < 0.005. Representative of two independent experiments.