
Figure 3. Identification of an Immunodominant CB H-2Db Restricted Epitope.
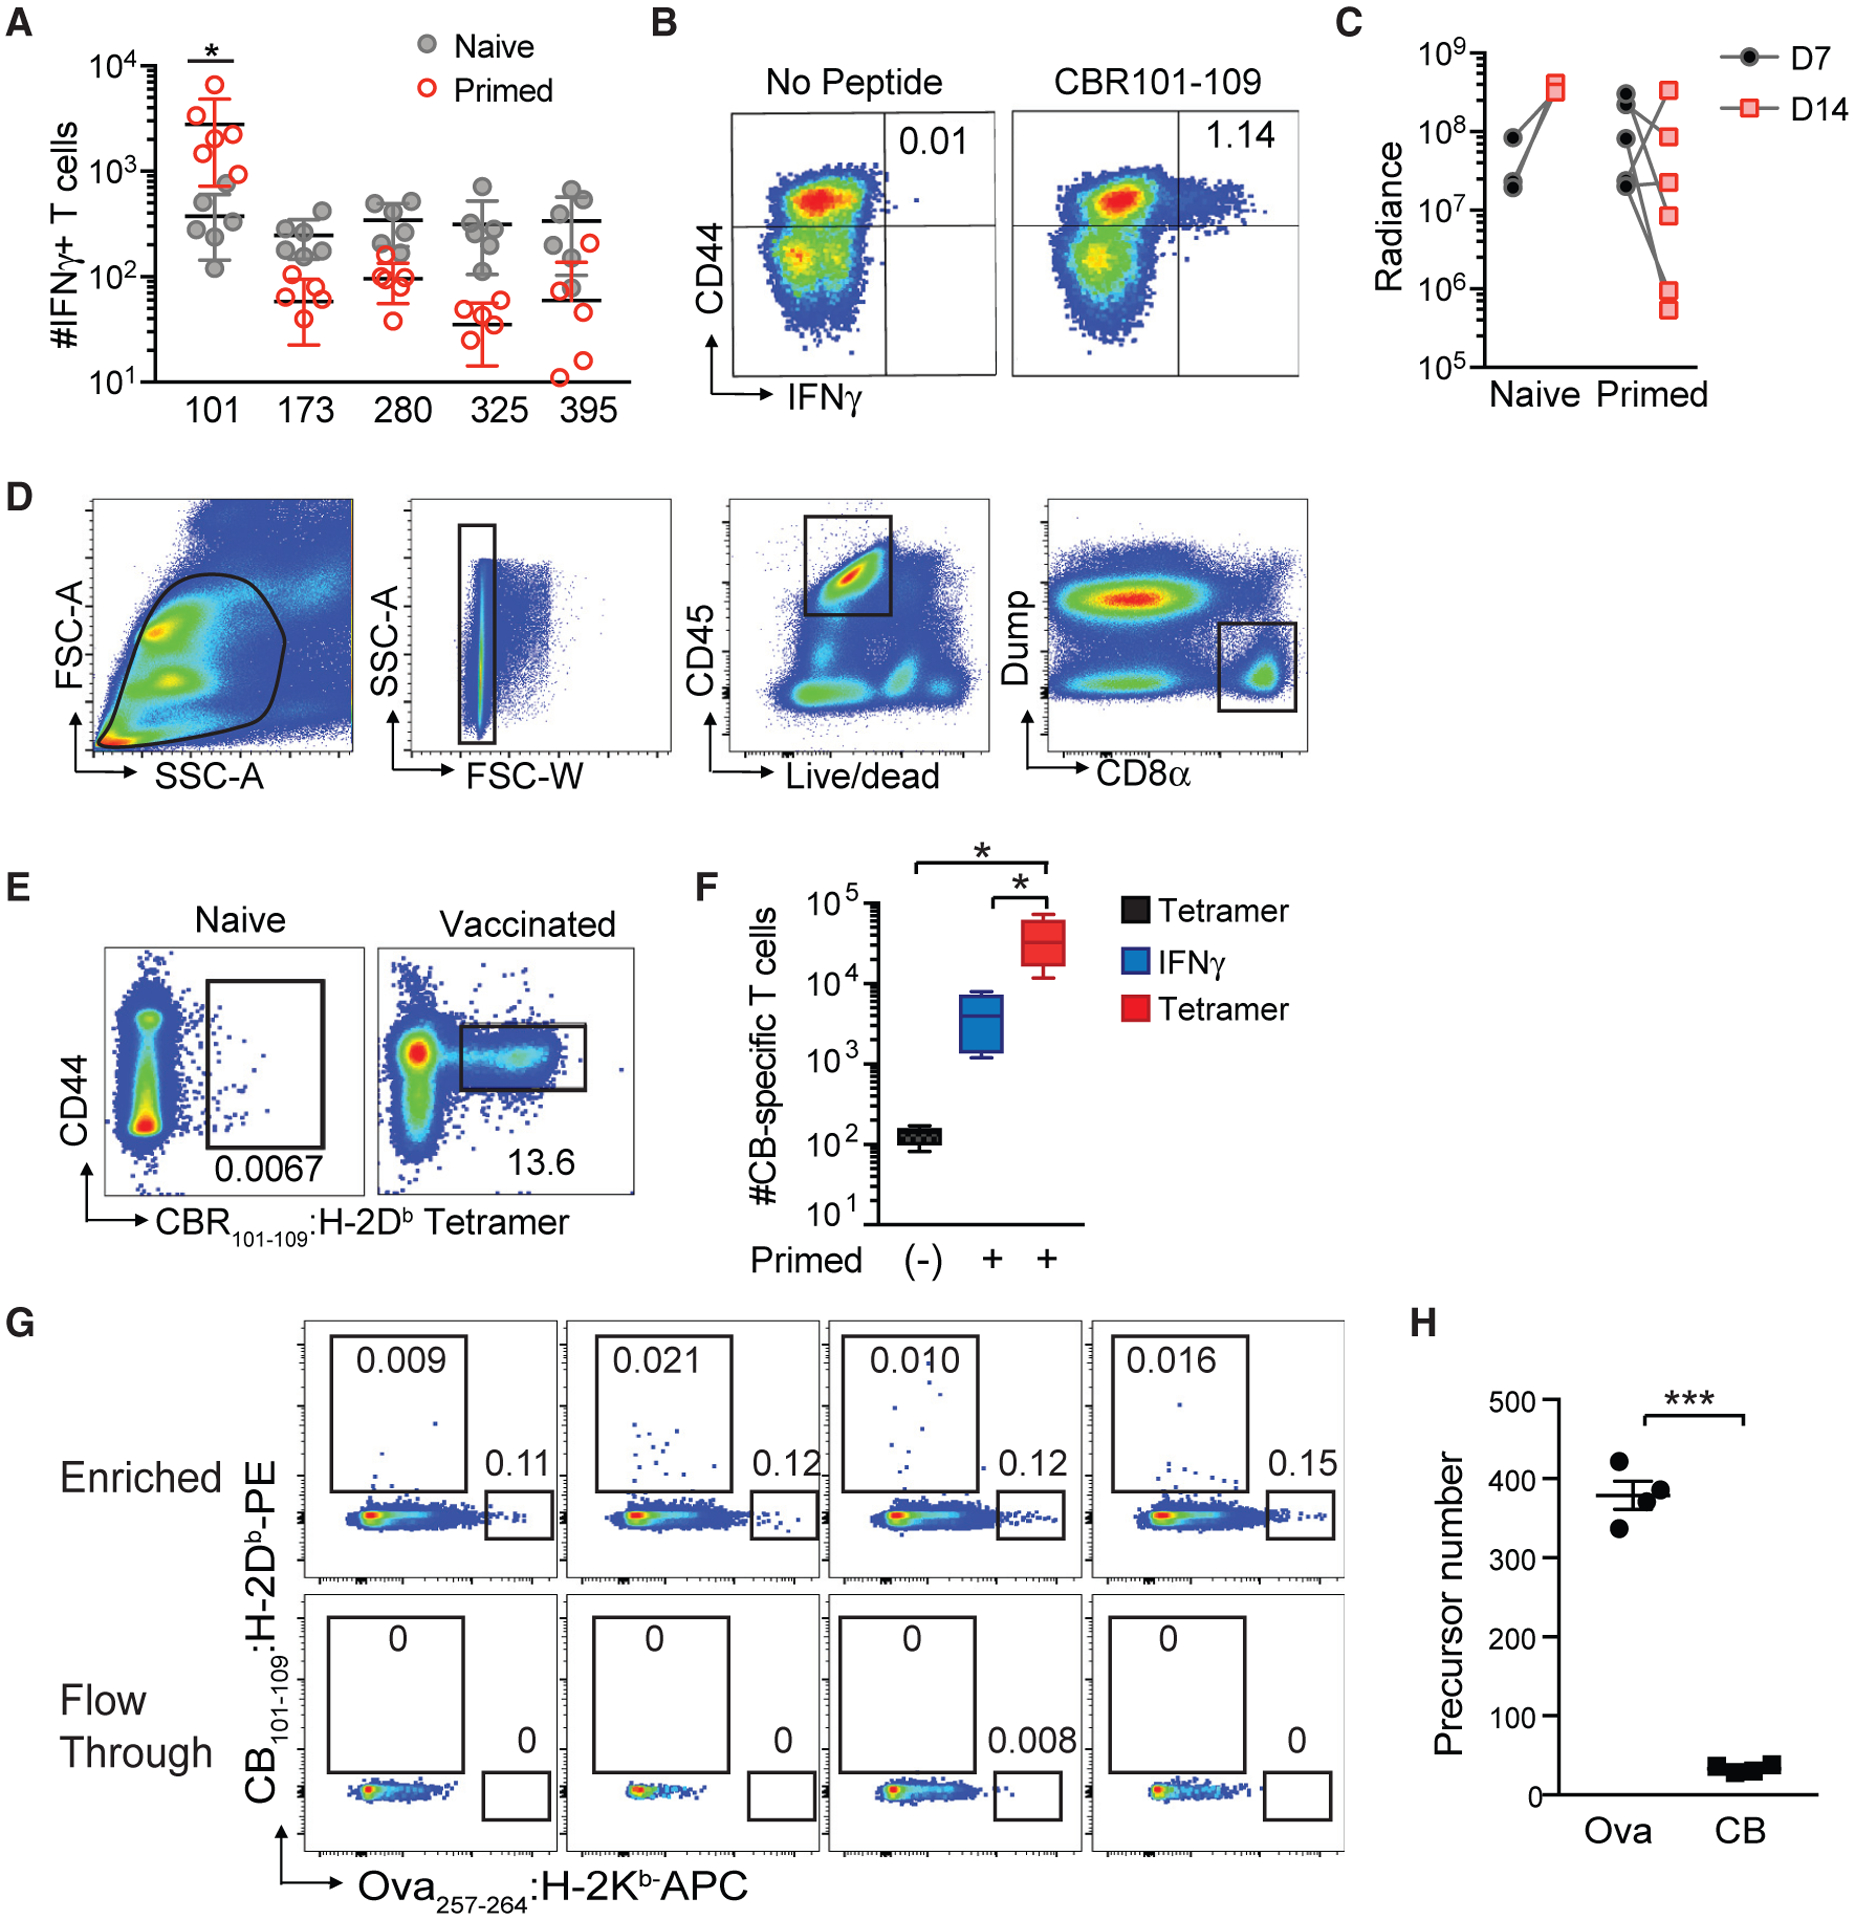
(A) Number of IFNγ-producing T cells per spleen from naive or peptide/αCD40/PolyI:C vaccinated C57BL/6 mice following ex vivo re-stimulation with the indicated peptide. Each dot is an independent mouse. n = 6 per group. *p < 0.05 (unpaired two-tailed Student’s t test).
(B) Representative CD44 and IFNγ staining of splenic CD8+ T cells following ex vivo stimulation with CB101–109 peptide. Plots are gated on live, CD45+CD8+ T cells.
(C) Tumor radiance from control or vaccinated B6 mice on days 7 (D7) and 14 (D14).
(D) Gating strategy for validating fluorescently labeled CB101–109:H-2Db -tetramer-binding CD8+ T cells.
(E) Representative CD44 and CB101–109:H-2Db -tetramer staining of splenocytes isolated from naive and CB101–109-immunized mice at day 7 post-vaccination. Plots are gated on live, CD45+ CD8+ Dump− T cells as shown in Figure 3D. n = 6 mice per group.
(F) Mean number of CB101–109-specific T cells per spleen in naive (−) or vaccinated B6 mice was determined by tetramer staining or measuring IFNγ-producing T cells in response to CB101–109 peptide ex vivo ± SEM. n = 4 mice per group. *p < 0.05 (one-way ANOVA, with a post hoc test to correct for multiple comparisons).
(G) Representative plots of CB101–109:H-2Db and Ova257–264 :H-2Kb tetramer staining of naive B6 splenocytes following tetramer staining and magnetic bead-based tetramer enrichment. Gates are on live CD45+ CD8+ Dump− T cells.
(H) Number of CB101–109:H-2Db- and Ova257–264:H-2Kb-specific T cells in naive B6 mice. Each dot is an independent mouse, and data are mean ± SEM. ***p < 0.0005 (unpaired two-tailed Student’s t test). See also Table S1 and Figure S2.