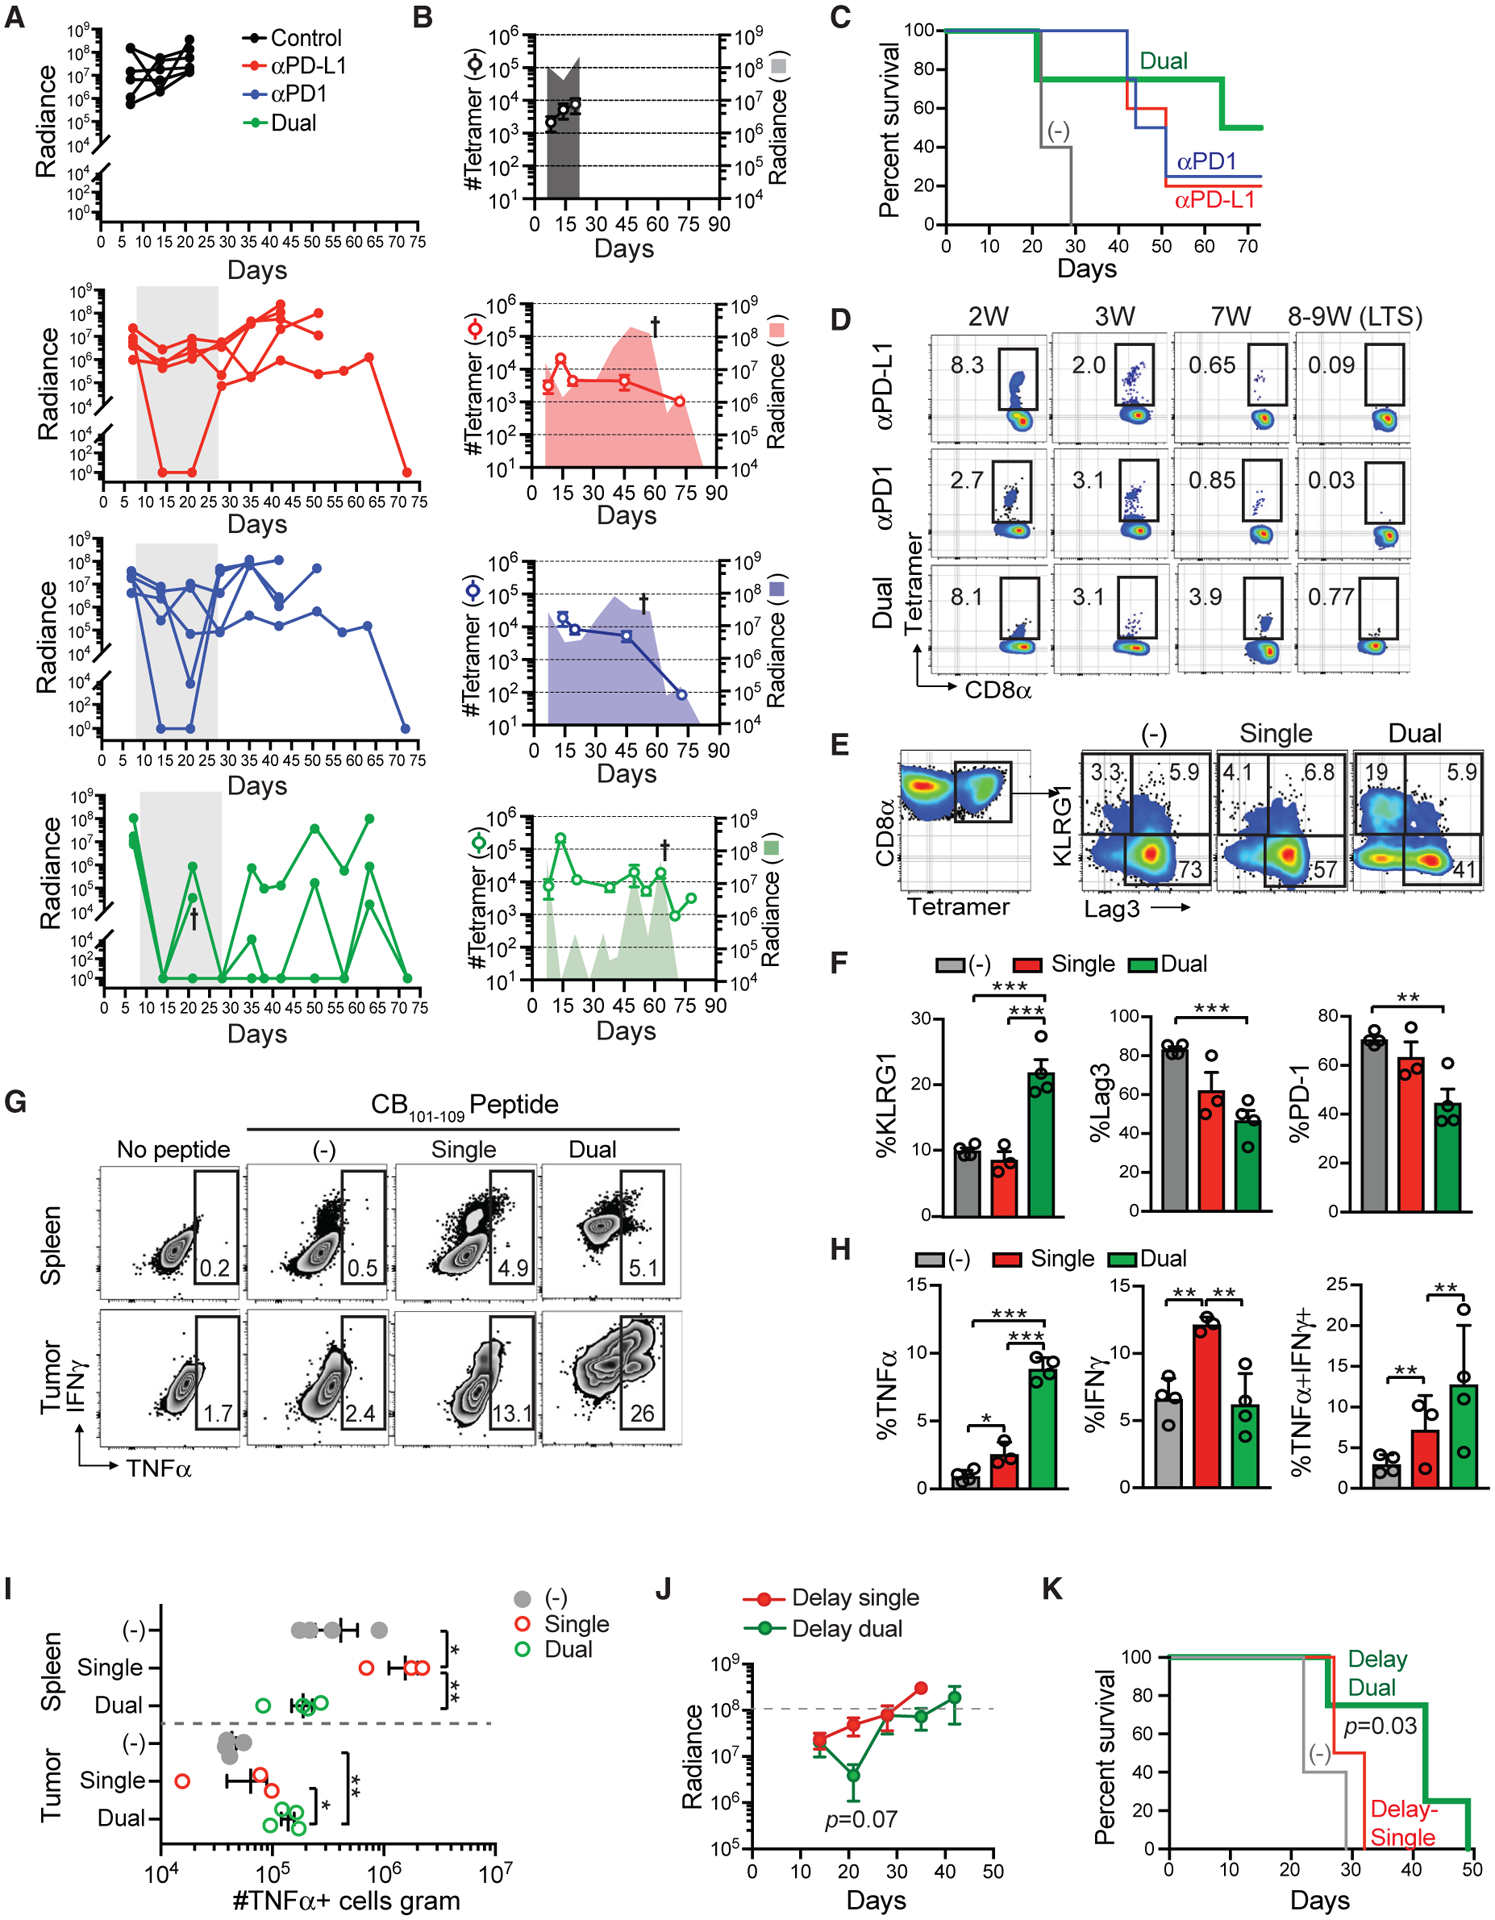
Figure 6. Combined PD-L1 + PD1 Blockade Promotes Tumor Eradication and T Cell Persistence in the Absence of Antigen.

(A) Radiance of tumor growth in mice treated with either αPD-L1 or αPD1, combination αPD-L1 + αPD1 (dual). Gray box indicates treatment period. Each line is an independent mouse. Arrow indicates unexpected death.
(B) Number of tetramer+ T cells per milliliter in blood and mean tumor radiance. Symbol indicates that some mice were euthanized because of tumor growth. Data are mean ± SEM for tetramer number. Data are mean for tumor radiance.
(C) Kaplan-Meier survival curve of mice in (A) and (B). n = 4 or 5 mice per group.
(D) Proportion of tetramer+ T cells (gated on live CD45+CD8+ T cells) in blood at the weeks (W) post-tumor. LTS, long-term survivors.
(E) Proportion of intratumoral tetramer+ T cells that express KLRG1 and/or Lag3 at day 14. Single, αPD-L1 only.
(F) Quantification of groups in (E). Data are mean ± SEM. *p < 0.05, **p < 0.005, and ***p < 0.0005 (one-way ANOVA with a Tukey post hoc test).
(G) Proportion of CD8+ T cells that produce TNFα following CB101–109 peptide re-stimulation ex vivo.
(H) Proportion of CD8+ T that produce the indicated cytokines from tumors in mice treated with single (αPD-L1) or dual (αPD-L1 + αPD-1) blockade at day 14. Data are mean ± SEM. *p < 0.05, **p < 0.005, and ***p < 0.0005 (one-way ANOVA with a Tukey post hoc test).
(I) Number of CD8+ T cells per gram that produce TNFα from mice treated with single or dual therapy at day 14. Each dot is an independent mouse. Data are mean ± SEM. *p < 0.05, **p < 0.005, and ***p < 0.0005 (one-way ANOVA with a Tukey post hoc test). See also Figure S5.
(J) Tumor radiance following delayed single (αPD-L1) or delayed dual (αPD-L1 + αPD-1) blockade beginning day 14 post-tumor implantation. Significant difference in tumor size at day 21 was assessed using an unpaired two-tailed Student’s t test. Data are mean ± SEM.
(K) Kaplan-Meier survival curve of mice in treated as in (J). Control group is the same animals shown in (C). Survival prolongation for delay dual (MST 42 days) versus untreated (MST 22 days) was determined by a log rank test. See also Figure S5.
