Figure 1.
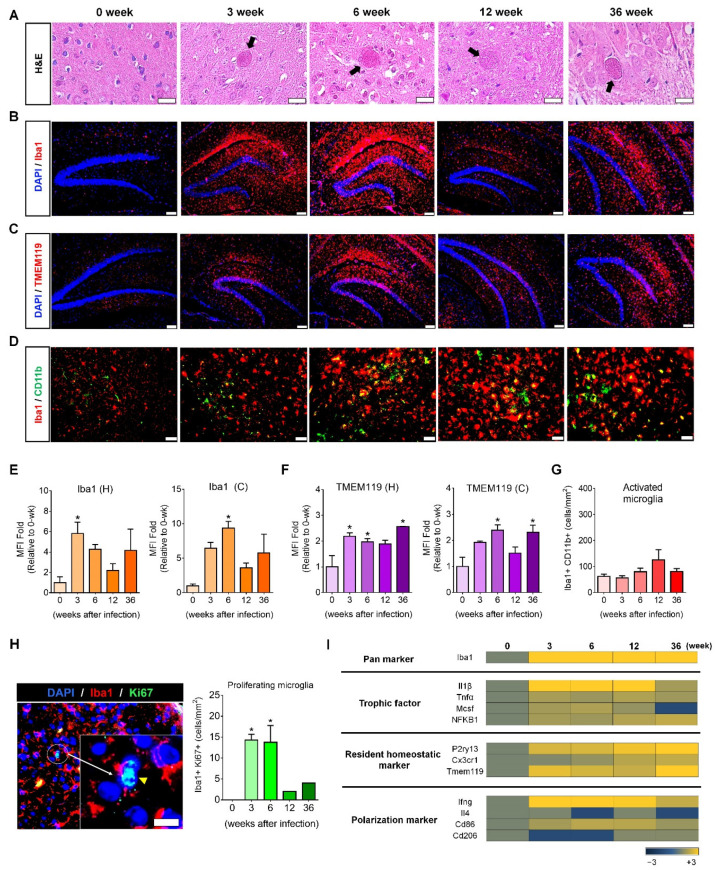
Proliferation and activation of resident homeostatic microglia over 36 weeks after Toxoplasma gondii infection. (A) T. gondii infection was confirmed by the presence of cysts in brain tissue (H&E staining; scale bar, 20 µm). (B) Microglia in the hippocampal formation were stained with Iba1 (red; scale bar, 100 µm). (C) Microglia in the hippocampal formation were stained with TMEM119 (red; scale bar, 100 µm). (D) Activated microglia were co-stained with CD11b and Iba1 (green and red, respectively; scale bar, 50 µm). (E,F) Mean fluorescence intensity (MFI) was calculated from fluorescence-stained images (B,C) using ImageJ. The fold changes of MFI at 3, 6, 12, and 36 weeks PI were compared with those of the control (0 weeks). H, hippocampus; C, cortex. (G) The number of activated microglia (Iba1+/CD11b+) was designated by cell number per mm2 of the brain tissue. (H) Ki67-stained proliferating microglia. The yellow arrow head shows microglial cells in the mitotic phase (sky blue) co-stained with DAPI (blue) and Ki67 (green), and the number of proliferating microglia (Iba1+/Ki67+) was designated by cell number/mm2 brain tissue. Scale bar; 20 µm. Quantification of MFI intensity and co-stained cell counting; two brain sections per mouse. (I) Microarray analysis of genes encoding trophic factors, homeostatic markers, and M1 and M2 markers in T. gondii-infected brain. Data are represented as the mean ± SEM. * Statistical significance compared with the control (* p < 0.05).

