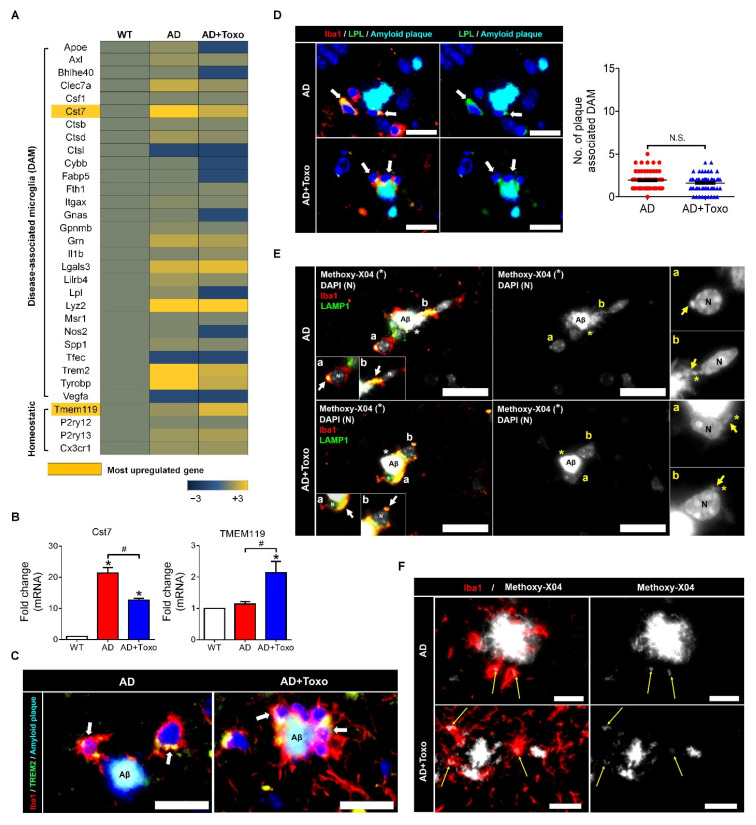
Figure 4.
Disease-associated microglia (DAM) phenotype of microglia and microglial phagocytosis. (A) DAM- or homeostatic markers of microglia investigated by gene array analysis. (B) qPCR results for Cst7 and Tmem119. (C) The TREM2 signal is a predictor of the DAM phenotype. (yellow, due to co-staining of Iba-1 (red) and TREM2 (green) and indicated by an arrow); Scale bar; 20 µm. (D) Lipoprotein lipase (LPL) signal as a stage two marker in DAM. The number of plaque-associated and LPL-expressing microglia. The counting result of microglia found around 60 amyloid plaques distributed in the brain ((10 randomly selected plaques per mouse) × 6 mice per group). (yellow, due to co-staining of Iba-1 (red) and LPL (green) and indicated by an arrow); Scale bar; 20 µm. (E) LAMP1 expression, and colocalization of LAMP1 and Iba1 in microglia around the amyloid β (Aβ) plaque. Lysosomal degradation of Aβ plaque as seen by the internalized puncta per microglial cell. Both “a” and “b” indicate LAMP1 positive lysosomes (white and yellow arrow) with the colocalization of methoxy-X04 stained amyloid β (*). Scale bar; 20 µm. (F) Internalized puncta per microglial cell indicate lysosomal degradation of the Aβ plaque (yellow arrow). Scale bar; 20 µm. Data are represented as the mean ± SEM. * Statistical significance compared with the control (* p < 0.05). # Statistical significance compared with each experimental group (# p < 0.05).

