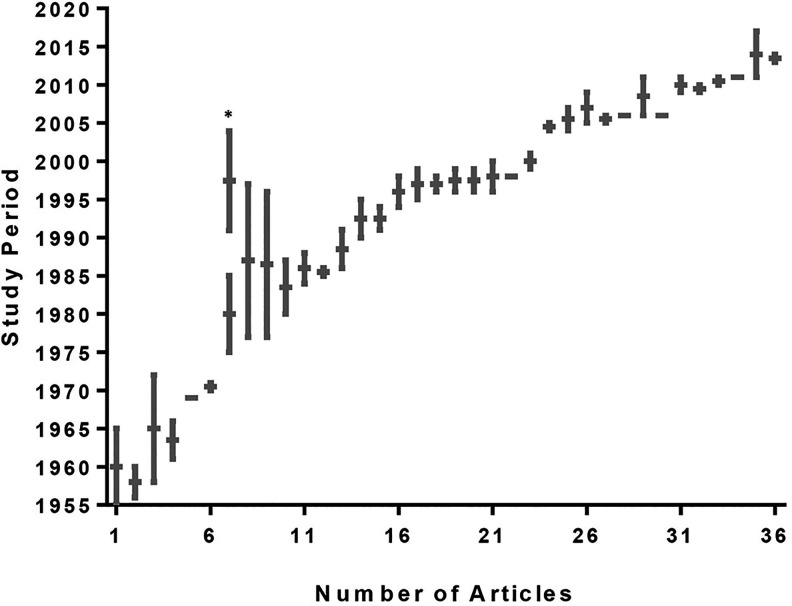
Figure 2:
Thirty-six articles with specified study periods. Single horizontal lines represent one year of study; four were case reports involving a single fatality (37,47,52,78). Vertical lines represent length of study and their intersecting horizontal lines their medians. * This 23 year study was based on 2 intervals (1975-1985 and 1991-2004) (44).

