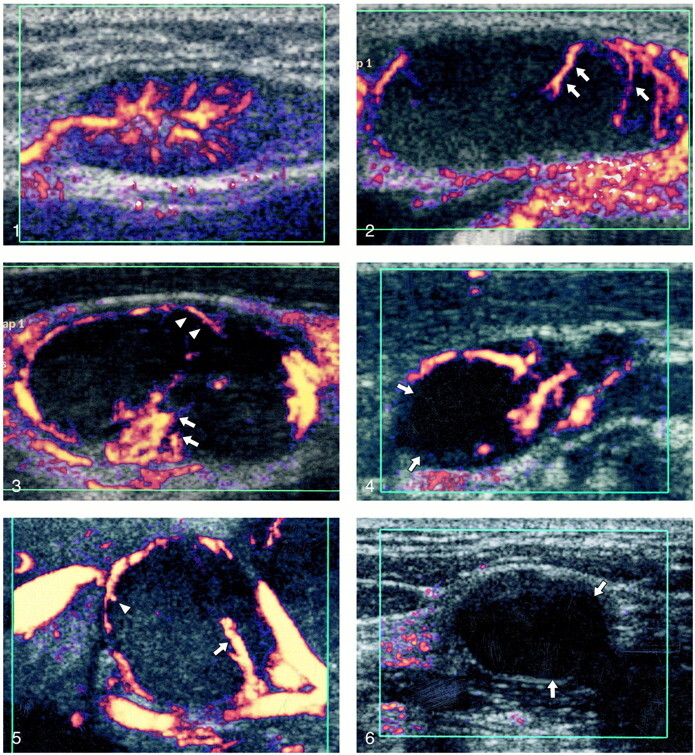
fig 1.

Power Doppler sonogram of a reactive node showing hilar vascularity.fig 2. Power Doppler sonogram of a malignant node showing capsular vascularity (arrows).fig 3. Power Doppler sonogram of a malignant node showing hilar (arrows) and capsular (arrowheads) vascularity.fig 4. Power Doppler sonogram of a tuberculous node showing displaced hilar vessels. Note the adjacent area of cystic necrosis (arrows).fig 5. Power Doppler sonogram of a tuberculous node showing hilar (arrows) and capsular vascularity (arrowheads).fig 6. Power Doppler sonogram of an avascular tuberculous node. Note areas of cystic necrosis (arrows)
