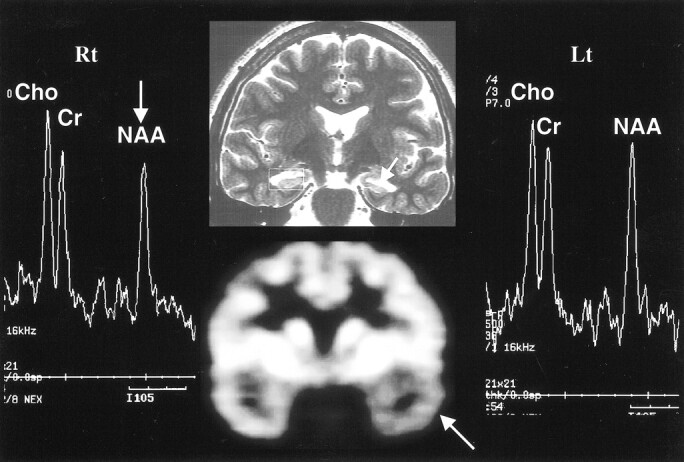
fig 2.

Discordant MRS with MR imaging and PET in left hippocampal sclerosis. Oblique coronal T2-weighted MR image (top row, middle) shows left hippocampal atrophy (arrow), in concordance with PET scan (bottom row, middle), which shows decreased metabolism in left temporal lobe (arrow). However, the MR spectrum from the left hippocampus (Lt) appears within normal range (false-negative finding), based on the abnormal criteria of an NAA/Cho ratio of 0.8 or less or an NAA/Cr ratio of 1.0 or less. The MR spectrum from the left hippocampus (Lt) shows a decrease in NAA/Cho and NAA/Cr ratios (arrow) on right side (Rt) (false-positive finding)
