
fig 3.
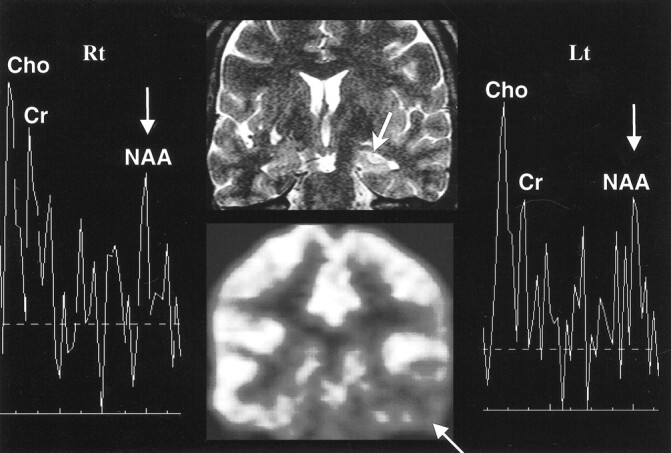
Bilateral abnormality on MRS in left hippocampal sclerosis. Oblique coronal T2-weighted MR image (top row, middle) shows left hippocampal sclerosis with increased signal intensity (arrow), in concordance with PET scan (bottom row, middle), which shows decreased metabolism (arrow) in left temporal lobe. The MR spectra (Rt and Lt) show bilateral abnormalities (arrows), decreased NAA/Cho ratios bilaterally, and decreased NAA/Cr ratio on right side