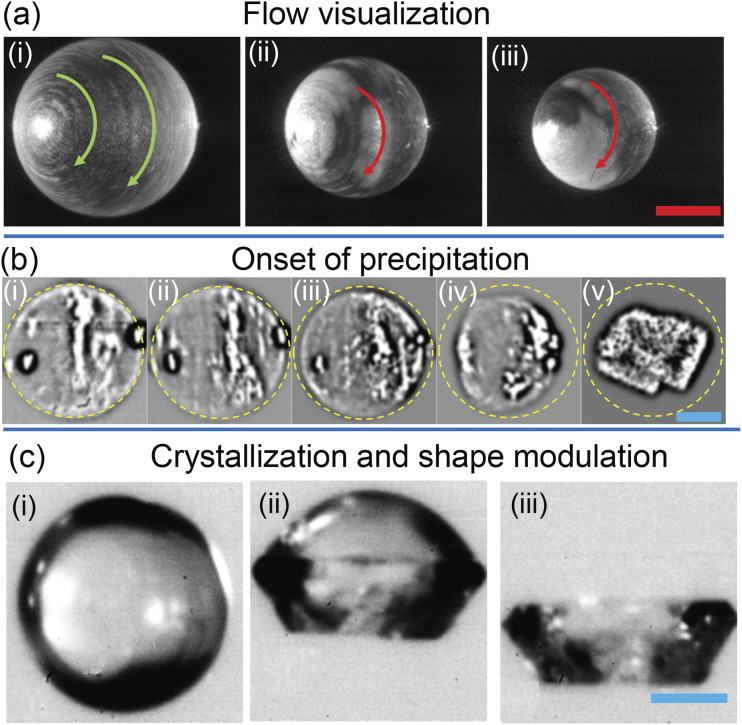
FIG. 2.
Flow visualization in case of φnp = 0 is displayed as the superposition of three consecutive images (3/2000 s) for φnp = 0 for (i) D/D0 = 1, (ii) D/D0 = 0.8, and (iii) D/D0 = 0.7. The scale bar in red is 0.2 mm. (b) The progression of precipitation in φnp = 0 is laser visualized and presented at (i) D/D0 = 0.27, (ii) D/D0 = 0.26, (iii) D/D0 = 0.24, and (iv) D/D0 = 0.2 intervals and (v) the final crystalline form. (c) The front illuminated droplet shape for φnp = 0 is shown at (i) D/D0 = 0.25, (ii) the spherical top-half and crystalline bottom half of the droplet, and (iii) the final crystalline form. The scale bar in blue is 50 µm. The angle of imaging leads to the asymmetric appearance of the vortical flow.

