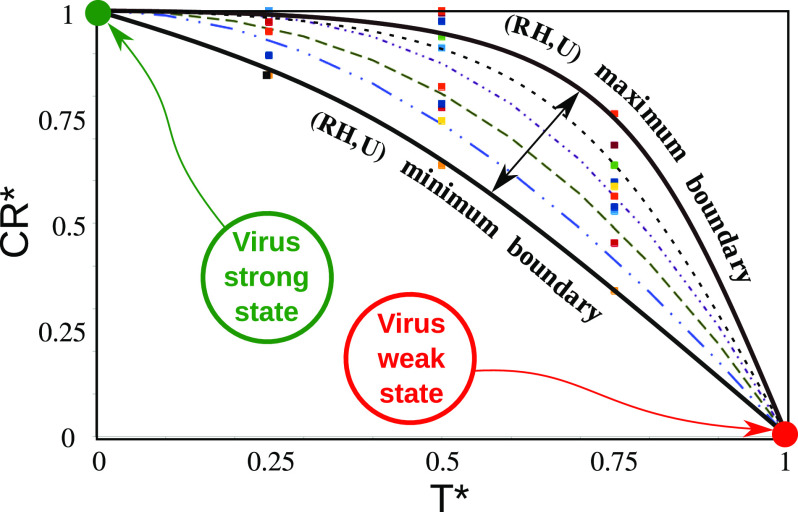
FIG. 5.
Scaling of the virus concentration rate (CR) with temperature (T), relative humidity (RH)). and wind speed (U). The solid square symbols represent the data points from the simulations. The lines (dashed, dotted-dashed, and solid) represent the single model predictions, which were found to fit all the data points very accurately. The two black solid lines are the maximum and minimum boundary limits for the range of data used to produce the results, (0 °C ≤ T ≤ 40 °C), (10% ≤ RH ≤ 90%), and (4 km/h ≤ U ≤ 20 km/h). The green and red circles show the strong and weak states of the virus particles, respectively. All the real variables denoted by ξ are made dimensionless by the 〈*〉 operator [see Eq. (4)]. min(CR) ≈ 0 and max(CR) ≈ 0.5.

