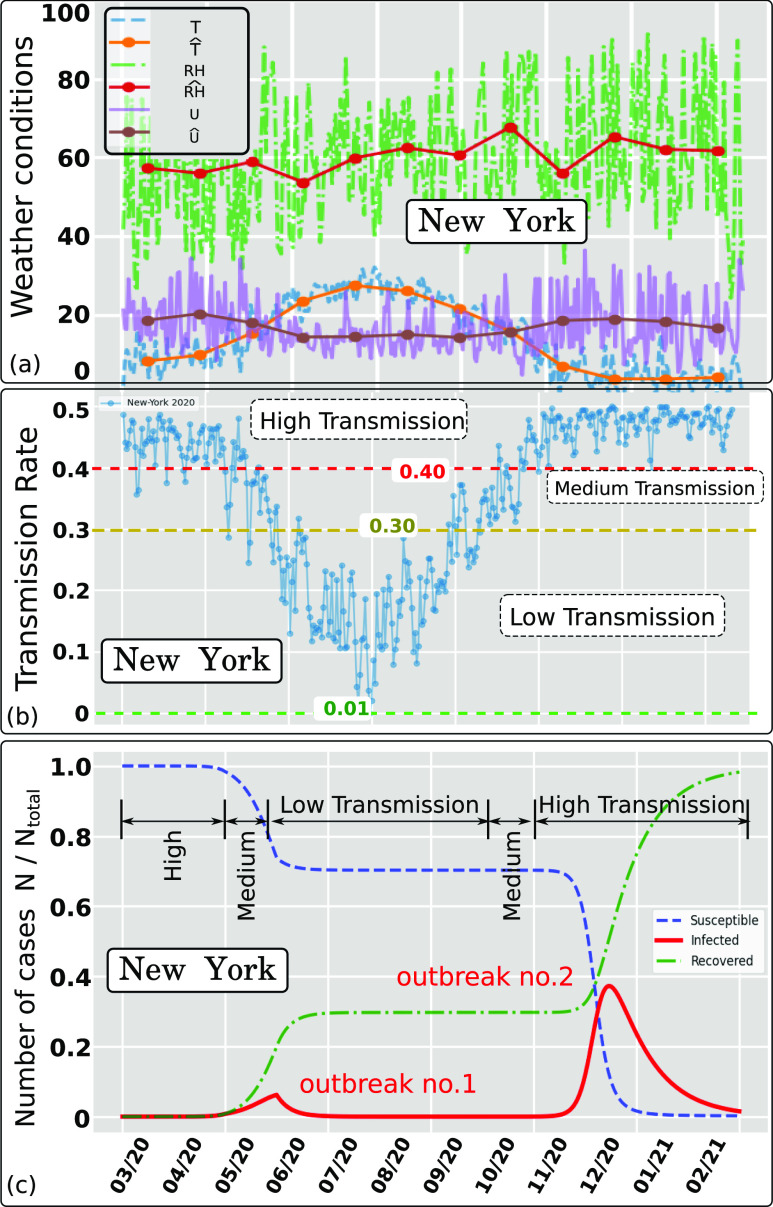
FIG. 8.
Effect of weather conditions (wind speed, temperature, and relative humidity) on the Airborne Infection Rate index (AIR = β) for New York state (USA) in 2020. The hat symbol denotes daily weather data averaged per month. (a) Weather data recorded between March and October 2020 (included) and estimated weather data between November 2020 and February 2021 based on the last year’s recorded weather. (b) Weather dependent transmission rate showing three trends denoted high, medium, and low separated by the respective threshold values 0.40 and 0.30. (c) Pandemic modeling and long time prediction (daily number of cases) using the weather-dependent transmission rate [Fig. 8(b)] in the standard SIR model.8 Two outbreaks predicted due to the weather seasonality in New York using I = 1 as approximate total infected individuals on 01 March 2020. Ntotal ≈ 19.47 · 106.

