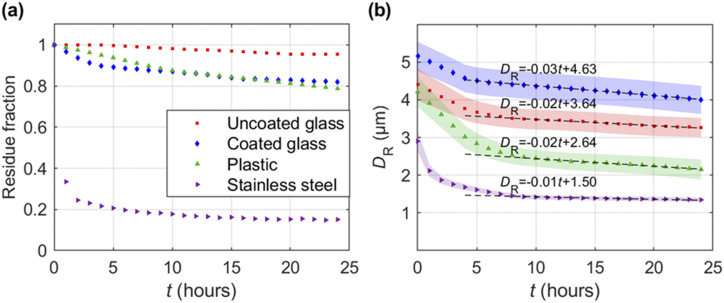
FIG. 4.
Long term stability of residues on various test surfaces measured at a temperature of 22 °C and humidity of 40% RH. (a) Residue fraction as a function of time on each substrate. (b) Average area-equivalent diameter DR of residues sampled over the same duration with the shaded region representing the standard error, and the dashed lines indicate the linear least-squares fit conducted over a range of t near the end of each dataset where a linear trend can be clearly observed, from above ∼5 h for coated glass to data above ∼8 h for the remaining.

