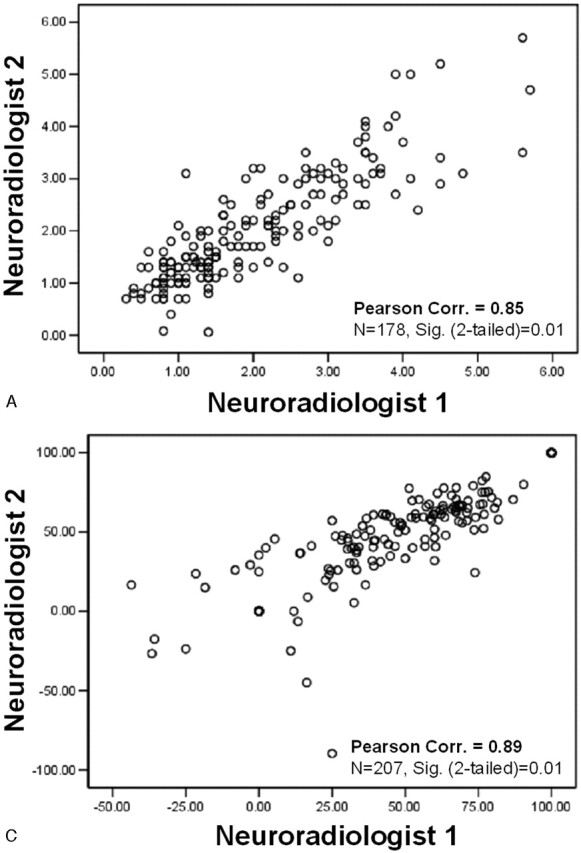
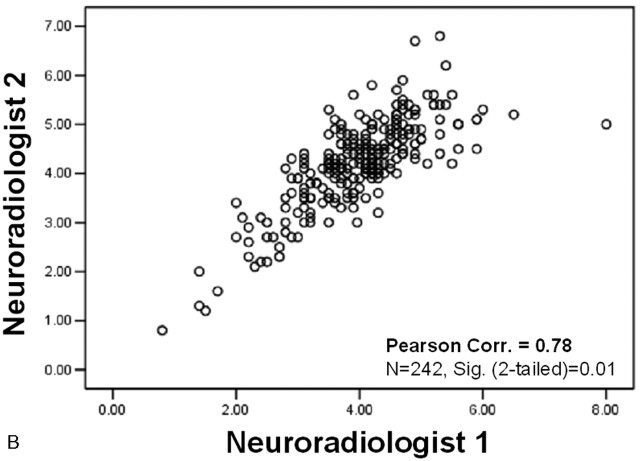
Fig 4.

Correlation scatter plots. Interobserver agreement between reader measurements. A, Maximum stenosis (mm). B, Distal ICA (mm). C, Derived NASCET-style percent stenosis. (Correlations: 2-tailed significance = 0.01. n values reflect exclusion of pairwise missing data; excludes “near-occlusion” cases).

