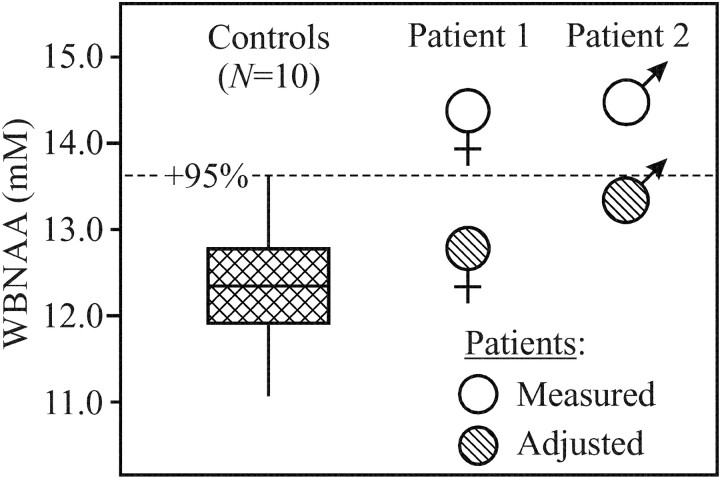
Fig 3.
Plot of first, second (median), and third quartiles (box) and ±95% (whiskers) range of the controls’ WBNAA distribution versus “measured” and “adjusted” levels of the 2 patients. Note that “measured” WBNAA (excluding the meningioma from brain volume) is significantly elevated, which suggests parenchymal compression. Correction of VB to preneoplastic size rendered adjusted WBNAA within the normal range, which indicates neuronal preservation.

