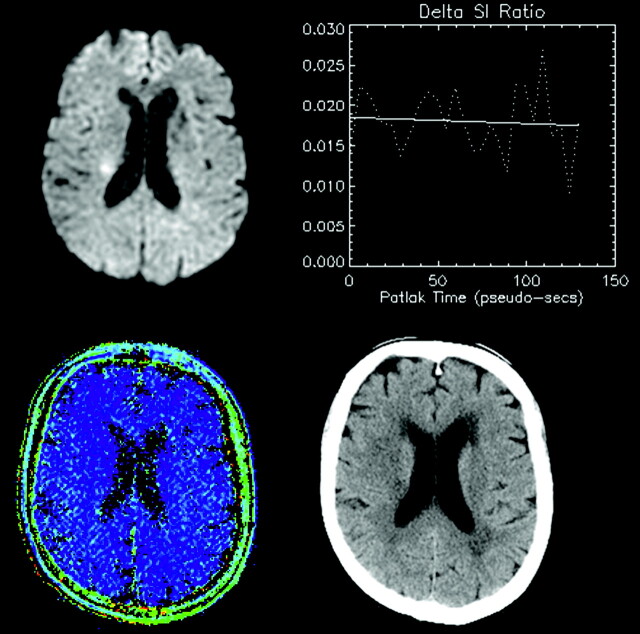
Fig 2.
A representative patient presenting with AIS (<24 hours), visible as hyperintensity on DWI (upper left). Lack of progressive signal intensity increase on serial T1-weighted images WIs is shown as a negligible slope of enhancement (upper right), and no corresponding hyperintensity on a pixel-by-pixel map of microvascular permeability (lower left). In this case, the permeability value in the hyperintense region was −0.14 mL/100 g/min. Follow-up CT (48 hours later) showed no evidence of HT (lower right).

