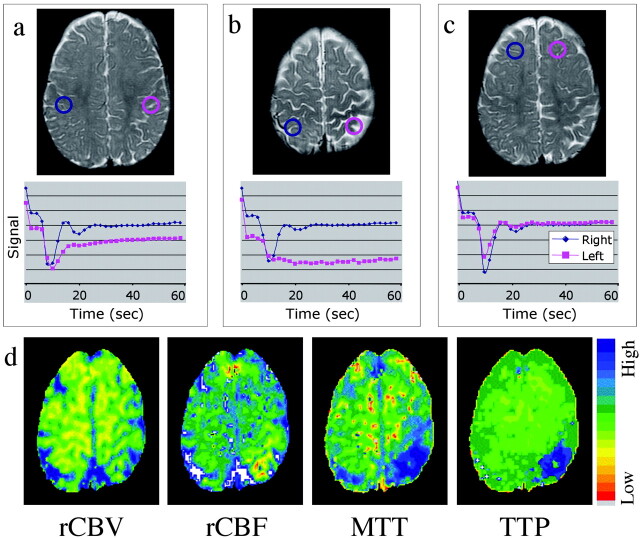
Fig 2.
T2-weighted images, time-series curves, and parameter maps generated from the same contrast-enhanced T2*-weighted perfusion image.
A, Time-series plot from contrast-enhanced T2*-weighted perfusion study shows delayed recovery phase, reflecting impaired venous drainage in the left parietal lobe.
B, Time-series plot shows delayed bolus arrival and protracted recovery, indicating arterial and venous perfusion abnormality more focally in the high left parietal cortex.
C, Symmetric time-series curves in the unaffected frontal lobes.
D, Parameter maps of regional cerebral blood flow, mean transit time, and time-to- peak show decreased flow and increased transit time in the same region. A very mild increase in regional cerebral blood volume is noted.

