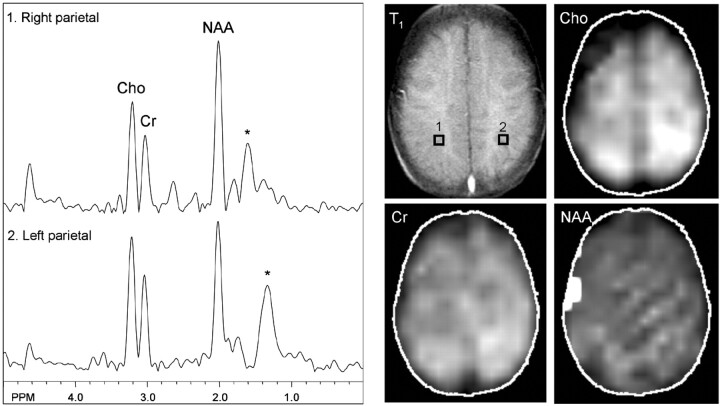
Fig 3.
MR spectroscopy at the level of the centrum semiovale shows nearly symmetric and normal levels of N-acetylaspartate and creatine. Mild elevation of choline is shown in the left parietal region, which is best depicted on the metabolic map. No lactate is detected. Asterisk marks broad peaks at 1.2 through 1.4 ppm that most likely reflect lipid contamination.

