
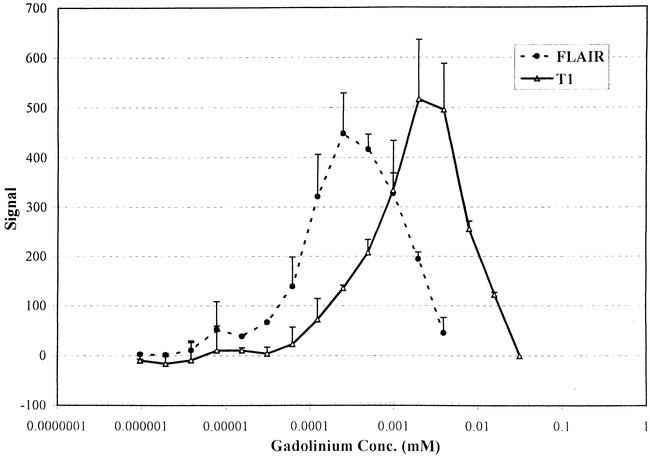
fig. 6. Graph shows the effect of varying the concentrations of contrast material (range, 0.000001 to 0.5 mM) on the mean FLAIR and T1 signal intensity in the test tube phantom. The error bars represent +ISD and the data are from two separate experiments.