
Fig 5.
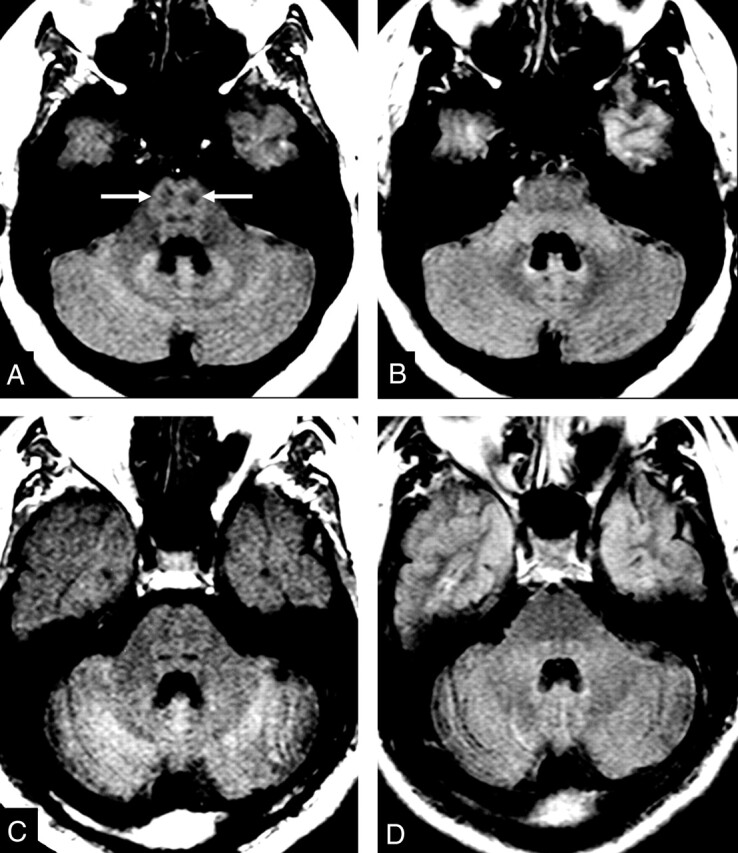
MR images of the CST in the brain stem.
A and B, Control subject. Hypointensity in the region of the CST in the brain stem on T1-weighted SE MTC image (arrows in A). CST is not visible on FLAIR image (B).
C and D, Patient with definite ALS. Abnormal lack of hypointensity in the brain stem on T1-weighted SE MTC image (C). FLAIR image does not show any abnormality (D).