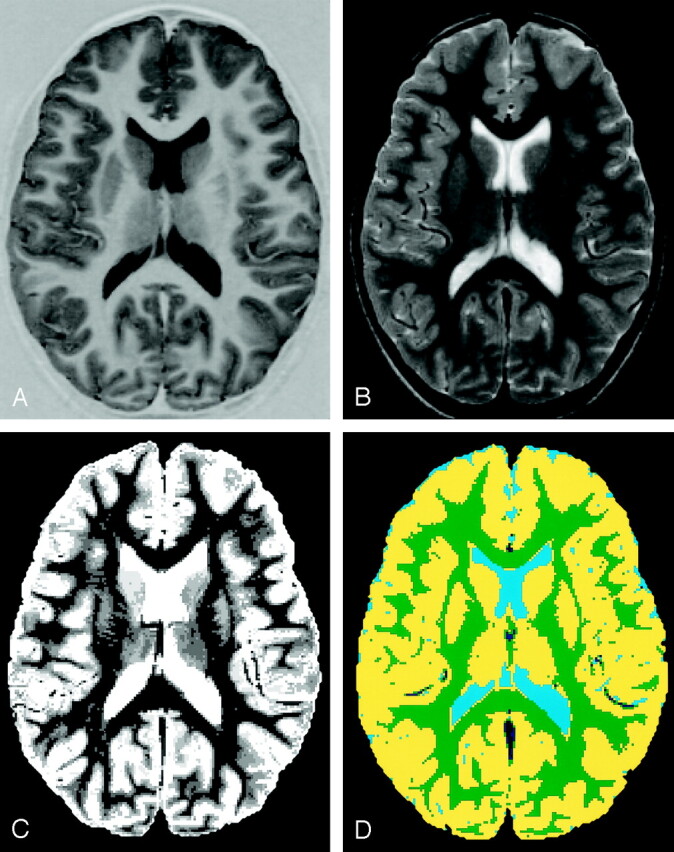
Fig 1.

Images obtained in a 7.8-year-old girl with SCD show how image segmentation was performed.
A and B, T1-weighted (A) and T2-weighted (B) MR images obtained at the same section level.
C, Segmented image made by combining T1-weighted, T2- or proton density-weighted, and FLAIR images shows 16 types of tissue as nine different gray scale levels.
D, Segmented and classified image shows gray matter (yellow), white matter (green), blood vessels and membranes (dark blue), and CSF (light blue). To calculate central gray matter (basal ganglia) volume separate from cortical volume, all tissues external to the basal ganglia were erased. The cortical gray matter volume was then calculated as a function of total gray matter volume minus central gray matter volume.
