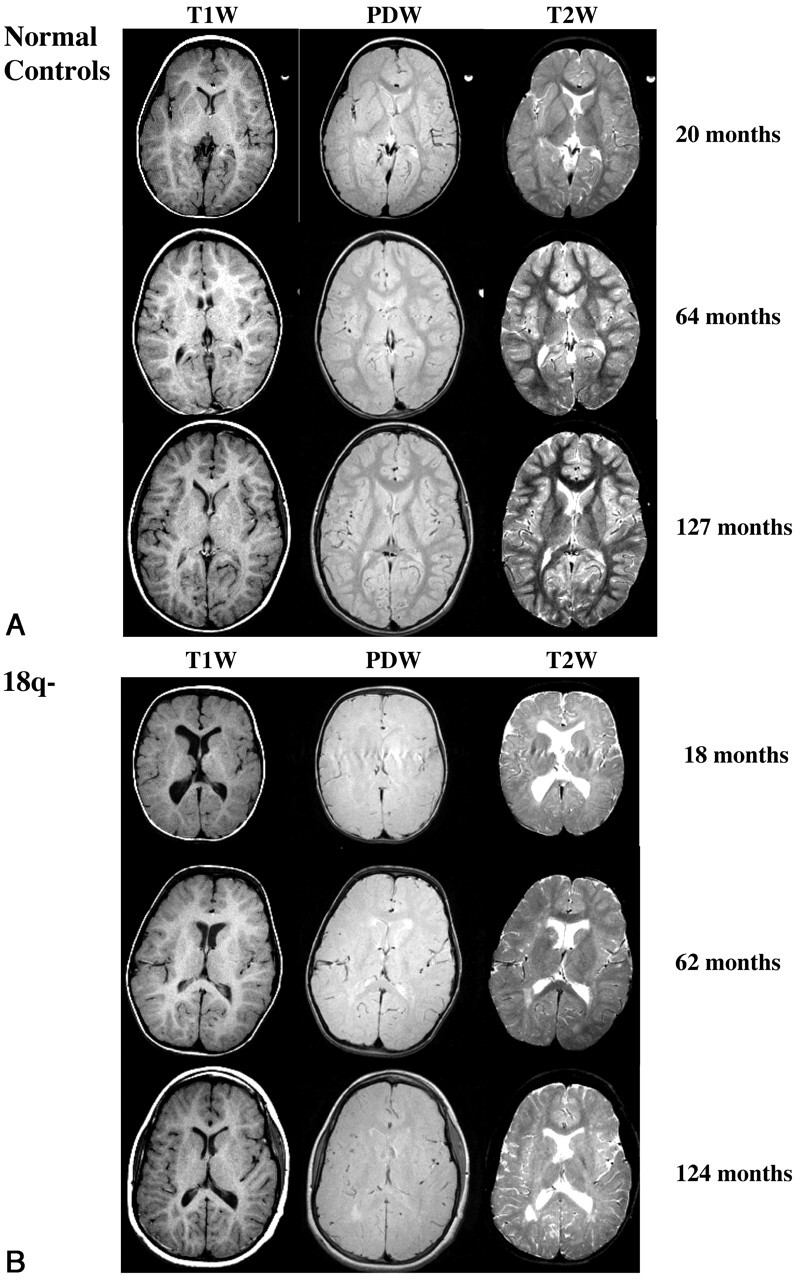
Fig 1.

Axial MR images illustrated changes on T1-, PD-, and T2-weighted images with increasing age. Right sides of the images represent the right side of the body. Note the inverted T2-weighted contrast at 18 months in the child with 18q− and low T2- and PD-weighted contrast extending to 124 months.
A, Three healthy control children.
B, Three children with 18q−.
