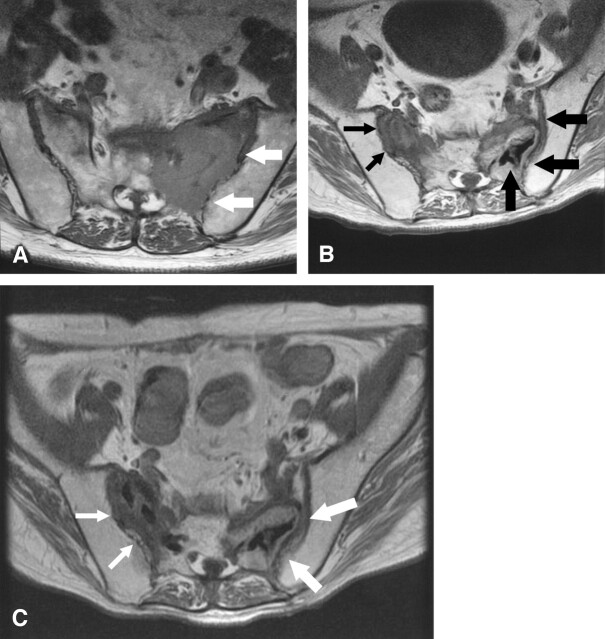
Fig 1.
Sequential MR imaging findings.
A, Axial T1-weighted MR image before the first pecutaneous sacroplasty shows a large osteolytic mass in left sacrum (arrows).
B, Follow-up axial T1-weighted MR image 3 months after the first percutaneous sacroplasty shows a slight reduction of left sacral metastasis (large arrows) and growth of right sacral metastasis (small arrows). Hypointensity in the left sacral tumor represents bone cement and n-BCA (curved arrow).
C, Follow-up axial T1-weighted MR image 35 days after the second percutaneous sacroplasty showed reduction of left sacral tumor (large arrows) and slight reduction of right sacral metastasis (small arrows).

