
Fig 1.
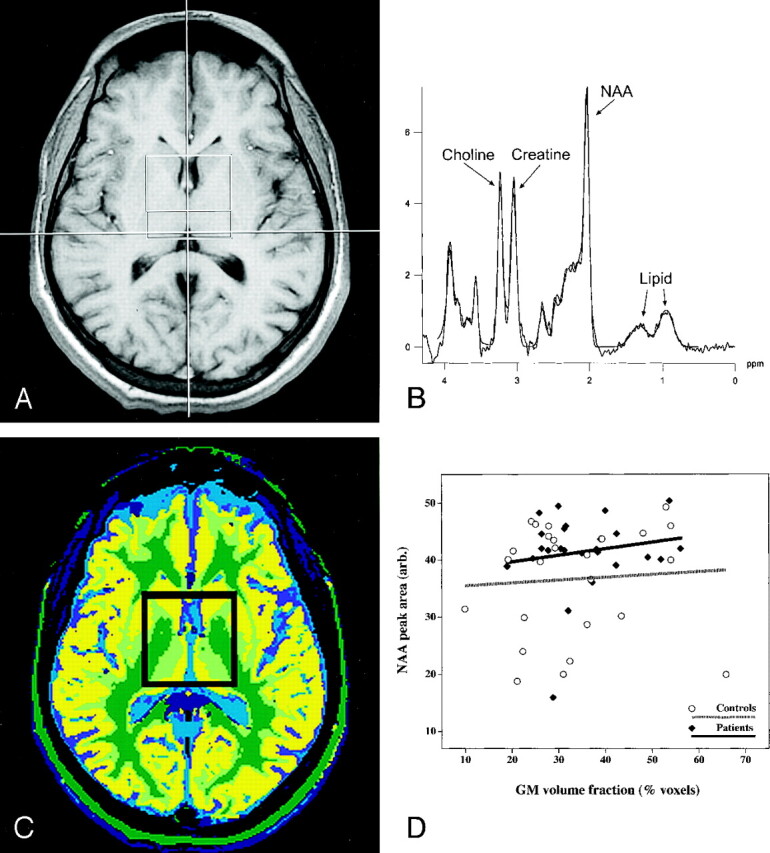
MR spectroscopic findings obtained in a patient with SCD.
A, Axial image shows a 4 × 4 × 1-cm VOI centered in the basal ganglia.
B, Short-echo spectrum acquired with a TR/TE of 1500/30 shows NAA, lipid, and other metabolites with a short spin-spin relaxation time (T2).
C, Spectroscopic VOI was segmented and classified by using a set of inversion recovery images acquired at the same section position to calculate the proportion of gray matter in the VOI.
D, Proportion of gray matter in the VOI was regressed against tissue NAA. Amount of NAA in the VOI did not change as a function of the gray matter volume in either patients or control subjects.