Fig 1.

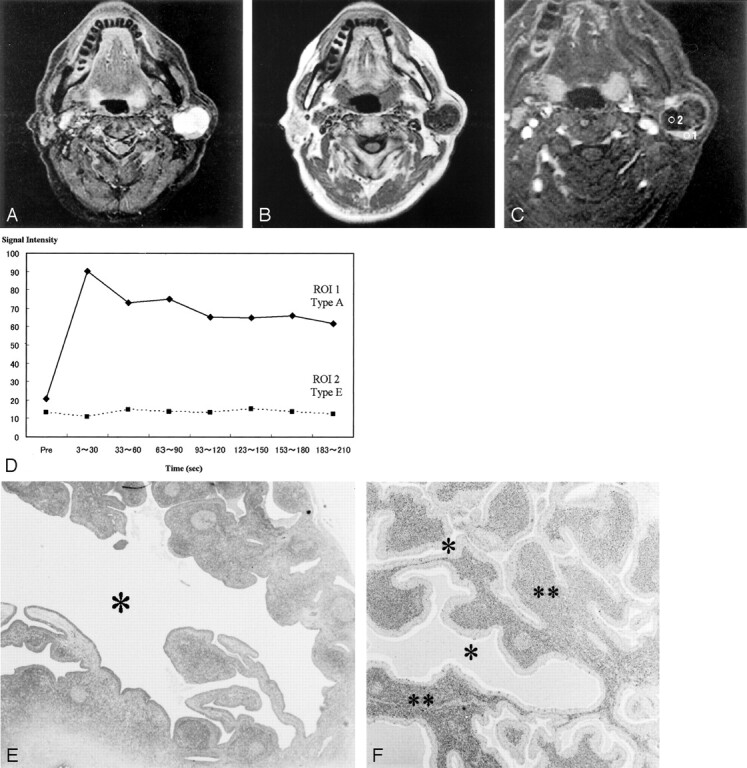
Images of a Warthin tumor in the left parotid gland of a 70-year-old man.
A, STIR image (4000/30), obtained in the axial plane, shows the tumor with moderate-to-high signal intensity. The high-signal-intensity area is a cystic lesion (*); the area showed no enhancement on contrast-enhanced images (see panel C, region of interest 2).
B, T1-weighted image (400/9), obtained in the axial plane, shows a hypointense tumor.
C, Fat suppression contrast-enhanced T1-weighted image (300/20), obtained in the coronal plane, shows solid (region of interest 1) and cystic (region of interest 2) tumor in the inferior pole of the parotid gland.
D, Signal intensity graph shows that the washout ratio of the solid component was 41%. The cystic region shows no enhancement (type E). The ADC values of the solid and cystic components were 0.96 × 10⁻³ mm2/s and 2.74 × 10⁻³ mm2/s, respectively. The ADC value of the spinal cord was 1.02 × 10⁻³ mm2/s.
E, Axial section of the specimen shows solid and large cystic components (*). The large cyst lost its contents.
F, Solid component has slitlike or dendriform spaces (*) lined with papillary proliferation of bilayered oncocytic epithelia, with supporting stroma composed largely of lymphoid tissue (**). The small slitlike cysts are filled with proteinous secretion.
