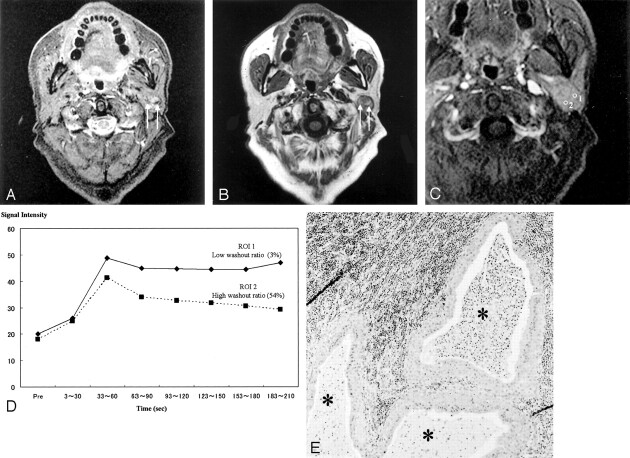
Fig 2.
Images of a Warthin tumor in the left parotid gland of a 61-year-old man.
A, STIR image (4000/30), obtained in the axial plane, shows the tumor to be iso- to hypointense to the parotid gland. Characteristically small low-signal-intensity foci (arrows) can be detected. The margin of the tumor also has hypointense foci.
B, T1-weighted image (400/9), obtained in the axial plane, shows the tumor to have the isointensity of muscle and relatively high-signal-intensity areas, whereas the STIR image shows low-signal-intensity areas (arrows). The margin of the tumor also is hypointense on T1-weighted images.
C, Axial dynamic contrast-enhanced image shows all areas of this tumor to have type B perfusion curves.
D, Signal intensity graph shows that foci that showed hypointensity on the STIR image and relatively high signal intensity on the T1-weighted image (region of interest 1) had a low washout ratio (3%) and the other region (region of interest 2) had a high washout ratio (54%).
E, Axial section of the specimen shows cysts containing proteinous fluid with inflammatory cells (*).

