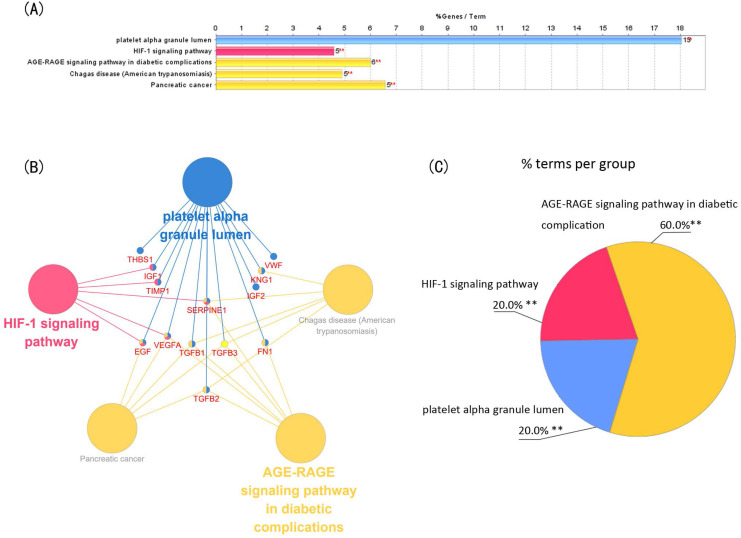
Figure 4.
Function analysis of the 13 core genes in module 1. (A) Enriched gene ontology (GO) terms and KEGG pathways. (B) Functions and pathways of the core genes were visualized using ClueGO. (C) Distribution of the functions and pathways among the core genes. Each function or pathway is color coded. Corrected P <0.01 was considered statistically significant. KEGG: Kyoto Encyclopedia of Genes and Genomes.

