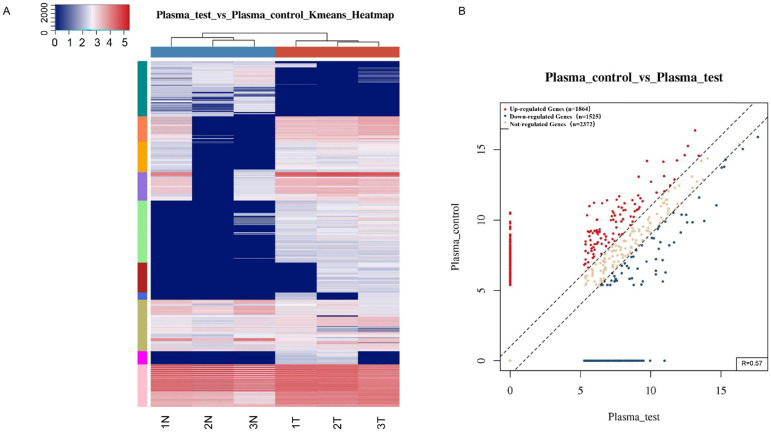
Figure 1.
Differentially expressed tsRNAs between gastric cancer patient plasma and healthy donors. (A) Hierarchical clustering heatmap. Each row represents a tsRNA and each column represents a sample. T, cancer patient; N, healthy control. (B) Scatter plots between two groups. The counts per million values of all tsRNAs are plotted.

