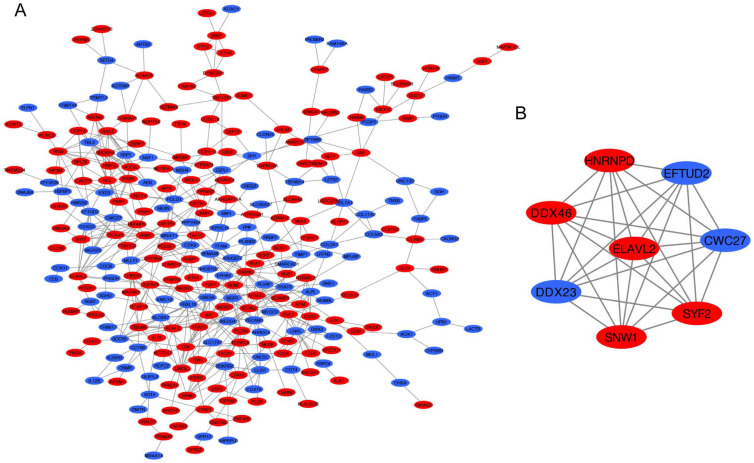
Figure 5.
PPI network analysis. (A) Construction of the PPI network. (B) The most significant module was selected from PPI network using the MCODE. Upregulated DEGs were marked in red nodes, and downregulated DEGs were marked in blue nodes. PPI, protein-protein interaction; DEGs: differentially expressed genes.

