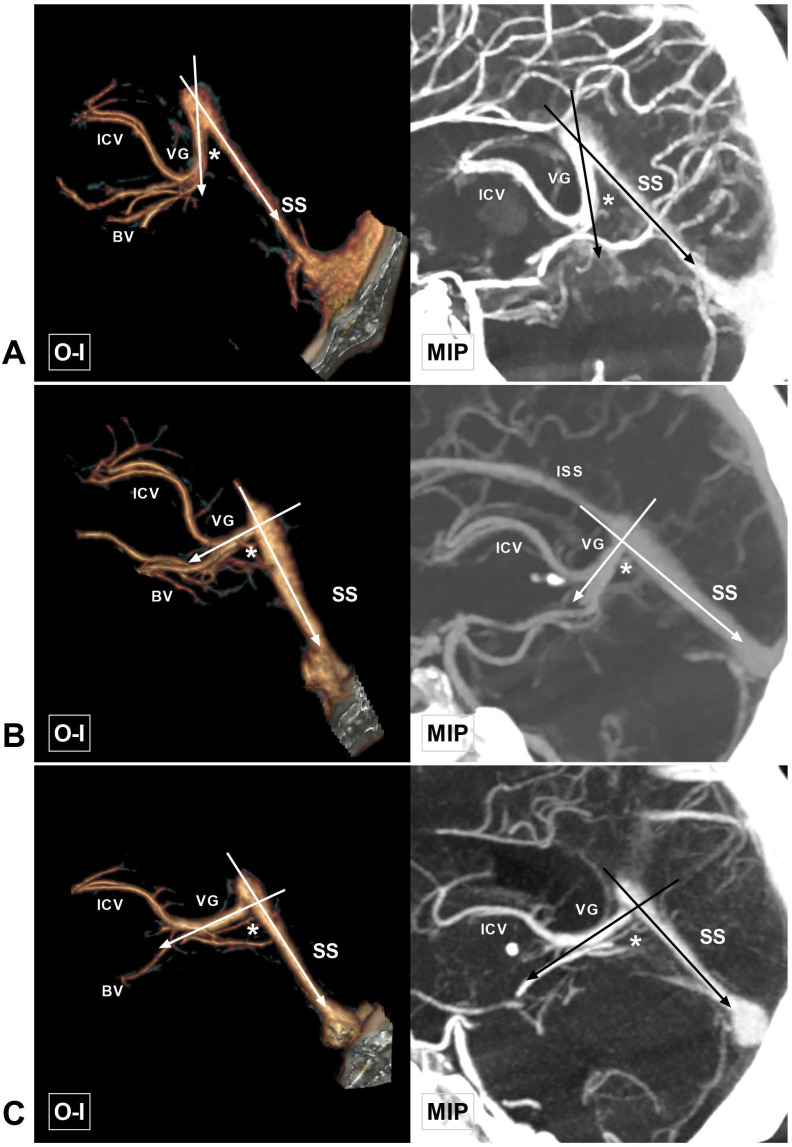
Figure 4.
Different angles at the VG and SS transition area. A, CTA and MIP show an acute angle at the VG and SS transition area (asterisk). B, CTA and MIP show a right angle at the VG and SS transition area (asterisk). C, CTA and MIP show an obtuse angle at the VG and SS transition area (asterisk). Abbreviations: BV, basal vein; CTA, computed tomography angiography; ICV, internal cerebral vein; ISS, inferior sagittal sinus; MIP, maximum intensity projection; O-I, outside to inside; SS, straight sinus; VG, vein of Galen.

