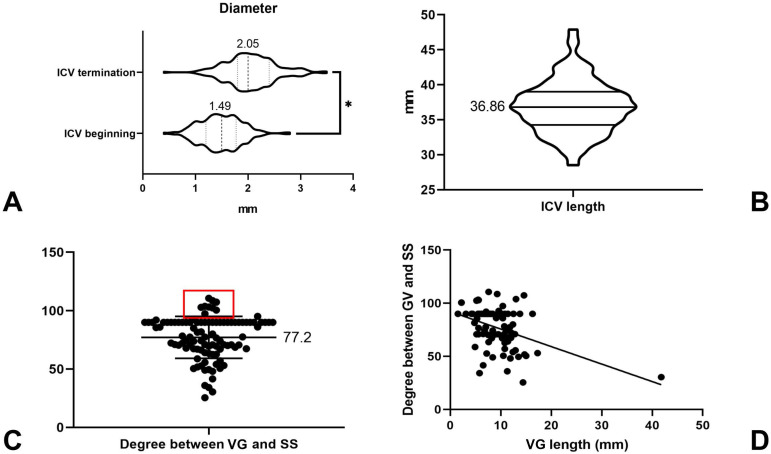
Figure 9.
Statistical results. A, The box and violin plot generated by an unpaired t test, which shows that the ICV diameter at the beginning is less than its terminal diameter (P <0.01). B, The box and violin graph shows the length of the ICV, averaging 36.86 mm. C, The plot shows the scatter distribution of the angle at the VG and SS transition area. The red rectangular area denotes the distribution of obtuse angles. D, Linear regression analysis shows that Y = -1.648*X + 92.18; the deviation from zero is significant (P value<0.01). Abbreviations: ICV, internal cerebral vein; SS, straight sinus; VG, vein of Galen.

