Figure 4.
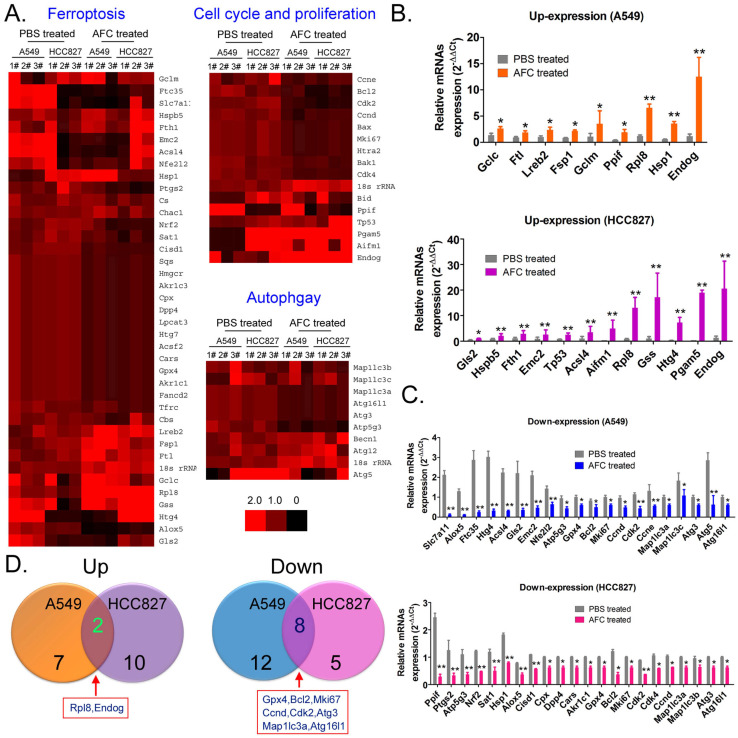
AFC promoted differential gene expression profiles of proliferation, autophagy, and ferroptosis in NSCLC cell lines. (A) Heat map of qPCR assay results. (B) The qPCR assay results showing that the mRNA expression levels of some cell proliferation inhibitors and ferroptosis promoting factors were significantly increased in the AFC cell group. **p < 0.01vs. PBS control group, *p < 0.05 vs. PBS control group, t-test, n=3. (C) The qPCR assay results showing that the mRNA expression levels of some cell cycle proliferation factors, autophagy promoting factors, and negative regulators of ferroptosis were significantly decreased in the AFC cell group. ** p < 0.01vs. PBS control group, *p < 0.05 vs. PBS control group, t-test, n=3. (D) A comprehensive analysis showing that the mRNA expression levels of two genes were significantly upregulated, and those of eight genes were significantly downregulated in AFC-treated NSCLC cell lines.

