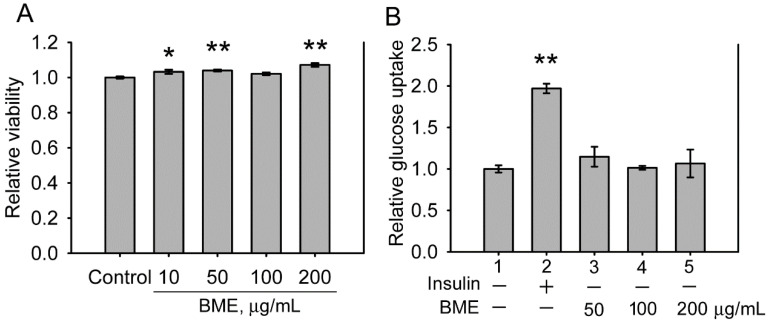
Figure 1.
The effects of BME on normal IEC-18 cells. A, cytotoxicity assays. IEC-18 cells were treated with the solvent (control), 10, 50, 100 or 200 μg/mL BME for 6 h and subjected to a cell proliferation assay. B, glucose uptake assays in IEC-18 cells treated for 5 h with 100 nM insulin, 50, 100, or 200 μg/mL EPSs as indicated underneath the histogram. Relative glucose uptake versus Group 1 was determined. Both experiments were performed twice independently, each in triplicate. The data are the mean ± SE (N = 6). *P < 0.05 and **P < 0.005 versus the control (A) or Group 1 (B).

