
FIGURE 1.
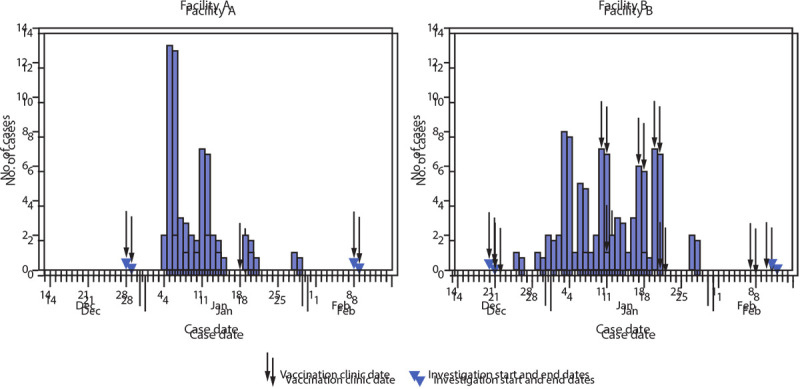
New SARS-CoV-2 cases* among residents of two skilled nursing facilities, by case date† — Connecticut, December 21, 2020–February 12, 2021§
* Any positive SARS-CoV-2 polymerase chain reaction or antigen test result.
† Symptom onset date or positive test result date, whichever occurred earlier.
§ Investigation period was December 29, 2020–February 9, 2021 for facility A and December 21, 2020–February 12, 2021 for facility B.