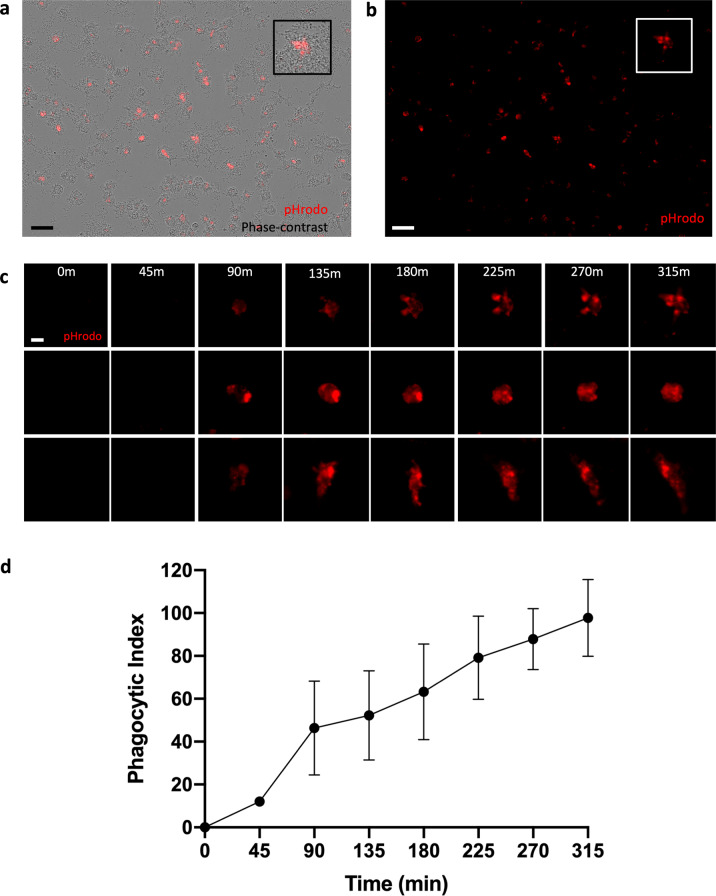
Fig. 5. Functional characterization of synaptosome engulfment by CB-iMGs derived from CB-MNCs exposed to maternal SARS-CoV-2 infection.
a Representative live real-time images in phase contrast/red fluorescence overlay mode showing cellular uptake and b red fluorescence channel alone of pHrodo (red)-labeled synaptosomes uptake at the end of the phagocytosis assay (315 min). Scale bar: 60 μm (boxes show the magnified view of engulfing CB-iMG). c Representative pHrodo (red)-labeled synaptosome engulfment in exposed CB-iMGs during live real-time imaging used for quantification. Scale bar: 20 μm. d Quantification of labeled synaptosome uptake by exposed CB-iMGs cells during live imaging. The phagocytic index represents the mean pHrodo+ area per iMG cell over N = 8 fields per well × 3 wells per line and N = 2 separate SARS-CoV-2-exposed CB-IMG line derivations. Error bars represent SEM.

