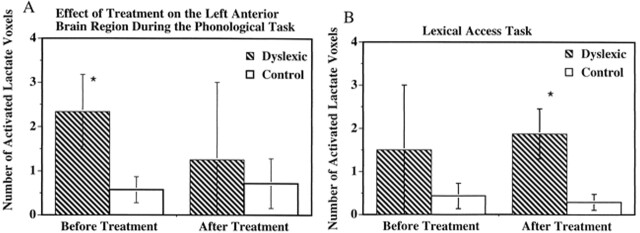
fig 1.
Bar graph of the number of average activated voxels (as defined by MR spectroscopy lactate increases) in the left anterior brain quadrant for both dyslexic and control participants. Within each graph, the data on the left were obtained before treatment, and the data on the right were obtained after treatment. Error bars indicate the standard error of the mean. The asterisk indicates dyslexic versus control comparisons that were significantly different. The data were collected using 4000/272 proton echo-planar spectroscopic imaging. A, Data obtained during the phonologic task from the left anterior brain. B, Data obtained during the lexical access task also from the left anterior brain region

